Like the turn of weather, the stock market has a way of changing and casting a new brightness or gloom that can pervade our mood and quickly have us forget the recent past. For those like your author, living in the marine climate of Puget Sound, we are accustomed to frequent weather changes and have adapted habits to adjust. One is “layering” our clothes so we are prepared to shed a layer when the rain lifts and we can enjoy a “sunbreak.” Your author will also confess an addiction to the weather app on his phone and to frequently looking at the southwestern sky to judge whether this might be a good time to walk the dog, mow the lawn, etc. But these reflexive ticks are not a substitute for preparation.
Likewise, preparation is far more important in financial planning than guessing the direction of markets. The opening of the year 2022 has seen a brisk decline in stock prices that may have us quickly forget the 26.4% advance in US stocks during 2021 as measured by the Russell 1000 Stock Index. As of this writing, US stocks are down 8.6% year to date, with the greatest decline (13.6%) in the growth stock component (using the Nasdaq Composite). Bonds, as measured by the Barclays Aggregate, are also down 1.8% because interest rates have risen to start the year. (Most bond values arithmetically move inversely to changes in interest rates.)
Apart from the March 2020 panic, periodic pullbacks in stock prices have been subdued in recent years, so when they happen, they gather more attention and feel more dramatic.
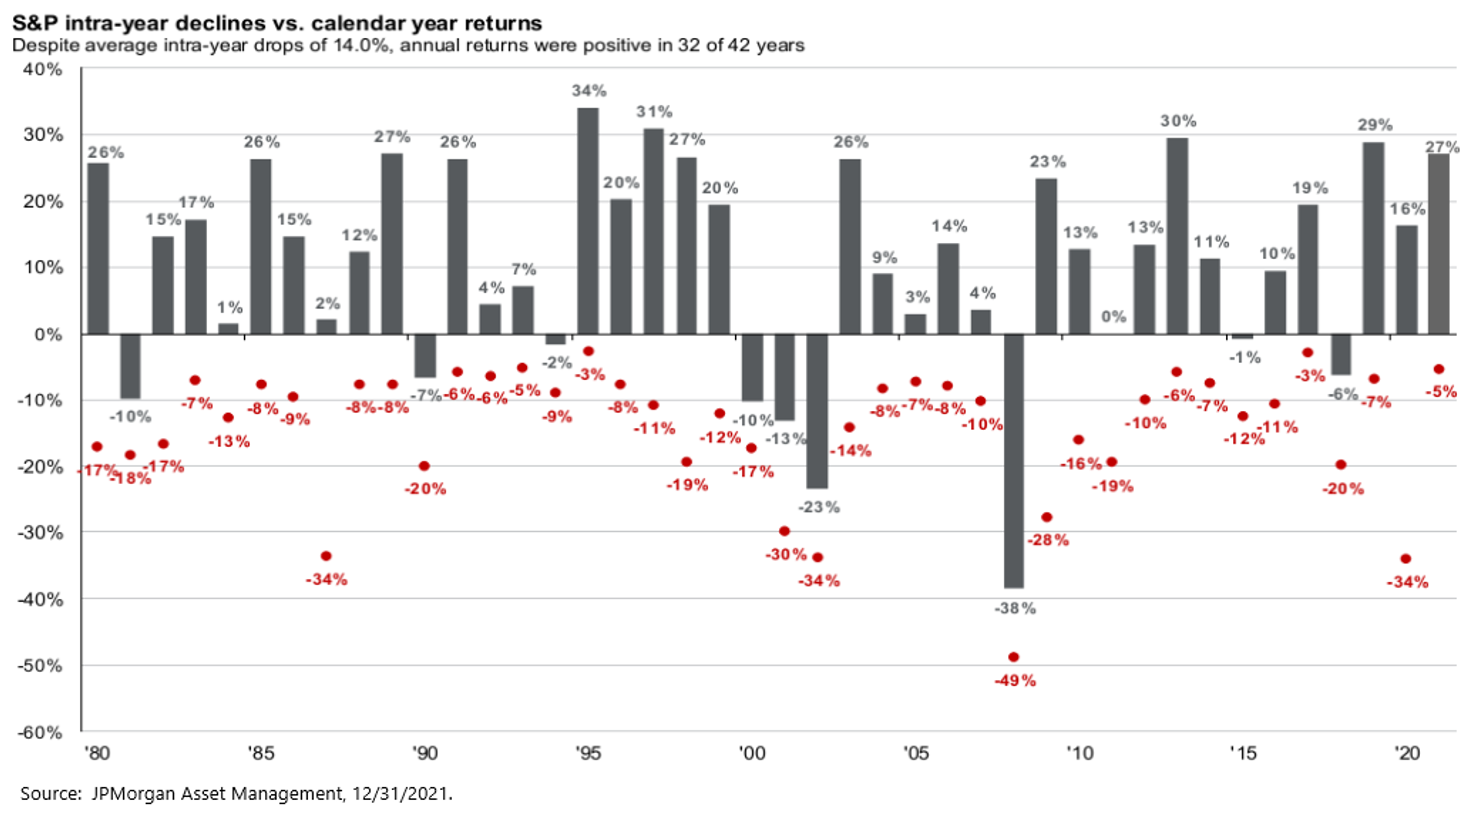
The chart above helps illustrates how routine and sizable intra-year pullbacks can be, even in the midst of a generally advancing trend.
Market Timing Versus Rebalancing. Stock market declines also bring out the proclamations of those who claim to have seen the decline coming and sold in advance. They rarely describe how far ahead they sold and so what advance in stock prices they gave up. And they are unlikely to be back to tout a well-timed re-entry that would have made the prior lost advance worthwhile. In any case, it is the repeated process of investing over decades that matters, not whether any one event is profitable, and it is well-known that repeatedly trying to time entries and exits from the stock market is a wealth-destroying endeavor.
The difficulty of market timing is thoughtfully explored in the latest newsletter (“Selling Out”) from famed value and distress investor Howard Marks of Oaktree Capital. Marks sets a list of considerations that we’ll quote in part here. (The letter can be found here, and is well worth reading.)
- Why sell something you think has a positive long-term future to prepare for a dip you expect to be temporary?
- Doing so introduces one more way to be wrong (of which there are so many), since the decline may not occur.
- Charlie Munger, vice chairman of Berkshire Hathaway, points out that selling for market-timing purposes actually gives an investor two ways to be wrong: the decline may or may not occur, and if it does, you’ll have to figure out when the time is right to go back in.
- Or maybe it’s three ways, because once you sell, you also have to decide what to do with the proceeds while you wait until the dip occurs and the time comes to get back in.
If we back up in time past the unique circumstance of the pandemic induced sell-off of March 2020, the most recent period of truly significant stock price decline (20%) was late 2018, which we wrote about in our newsletter the following January. There we described the process of rebalancing that is our practice as the means to capture value from stock market declines:
[O]nce stock prices have fallen, investors with mixed portfolios of stocks and bonds have the opportunity to buy stocks at prices that represent a discount from higher prices in the recent past. Because the long-term trajectory of the stock market is up, any trimming of bonds in a portfolio to purchase stocks following a decline represents a capture of value in the decline avoided up to the point the bonds are sold. This “trade” can be done to rebalance a portfolio to the stock/bond proportions of an investment policy (consistent with our usual annual practice with client portfolios), or the purchase could go further and represent a tilt beyond policy in favor of stocks (a shorter-term opportunistic shift). However, because any transaction involves expense and effort and any portfolio has limited “dry powder” in the form of bonds that would be trimmed, we are required to be very thoughtful about selecting the time to make such an opportunistic move.
This is exactly the method pursued in March 2020 when we executed a sale of core bonds for clients to purchase stocks following a decline of about 30% in stocks at the onset of the Covid pandemic. And less dramatically, this same discipline is applied at each client portfolio rebalance as part of the annual review. Thus far, the retreat in US stocks isn’t significant enough to warrant a major purchase and, as described below, other geographies offer better value and have been the destination for incremental client dollars through recent portfolio rebalances.
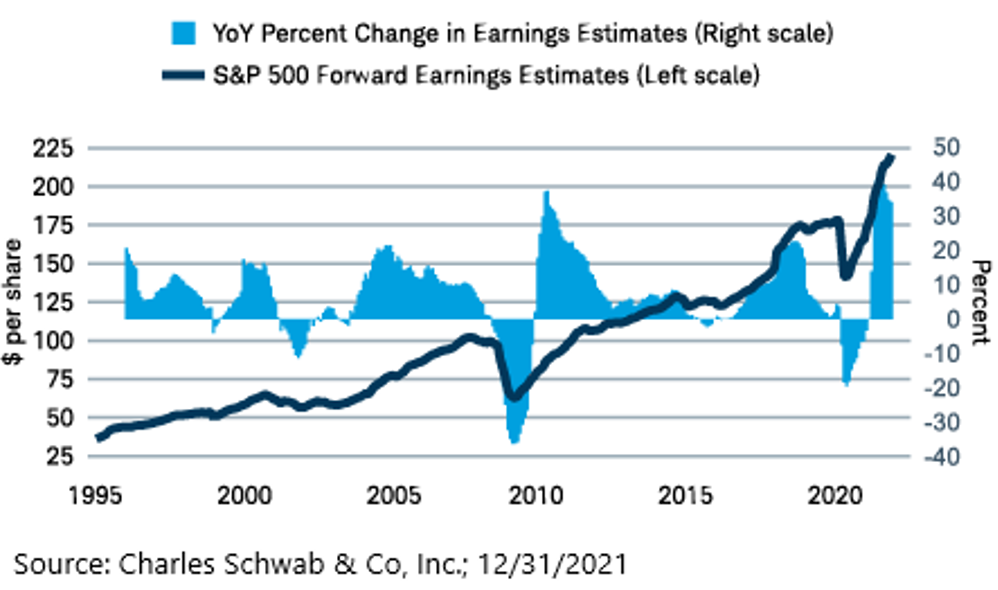
Prospect for Further Stock Market Volatility. We expect that stock prices in the US could stay volatile for some months as the contest between rising corporate earnings expectations (see chart at right) and rising interest rates play out. Rising earnings boost stock prices, and you can see that the expected increase in earnings is quite robust. Rising interest rates can coincide with stock price advances for a while because the Fed is often raising rates in conjunction with improving economic performance. Eventually, however, rate hikes raise the direct cost of corporate capital in the form of interest paid on corporate debt (a negative for corporate earnings and therefore stock prices) and cause an incremental shift of investor dollars towards bonds as investors are attracted to better bond yields.
For one illustration of the magnitude of possible decline and period of adjustment, we consider the last Federal Reserve tightening cycle, which started officially in December 2015 with a 0.25% increase in the target federal funds rate from the effectively zero interest rate policy (ZIRP) that had been in effect since the Global Financial Crisis. However, stock market anxiety about the Fed hiking rates first showed in August 2015 and came in the form of a 12% decline by late September, despite the Fed having discussed for two years the need to exit ZIRP. The stock market recovered by November, but started declining again in December, reaching a low in February 2016 (six months after the first market jitters), representing a retreat of about 13% from the prior peak. That month the Fed put a hold on further hikes and didn’t hike again until December 2016. The stock market, which had been gaining since the February 2016 low, took the hike in stride and continued to advance generally until January 2018, even as the Fed largely continued hiking rates at most Fed board meetings.
Thus, despite the typical desire one feels for action in response to the first instance of volatility, it is prudent to give the market some space of time to fully exhibit the anxiety that may be animating stock prices. The Fed hasn’t even made its first rate hike of this cycle; it has simply given up describing inflation as “transitory” and indicated (through various Fed governor speeches and Federal Open Market Committee minutes) an earlier date for the first hike (seemingly to March 2022) and an earlier reduction in its purchases of Treasuries and mortgage-backed securities.
Economic conditions between the two cycle commencements are also quite different. In 2015, corporate earnings were under pressure and had declined from 2014. Today, earnings are growing very strongly, although expected to temper as federal support for consumers and businesses from 2021 is not continued in 2022. Forward price-earnings multiples also are higher today than in 2015, although ratios came down in 2021 even with the stock market’s brisk advance because earnings grew faster than stock prices last year. Unemployment in 2015 was 5% while today it is under 4%, although labor force participation is also down about 1.5% from the pre-Covid level.
Another key difference is that inflation today is quite pronounced (7%, as measured by the top-level Consumer Price Index) and cited in consumer surveys as an item of real concern, whereas it was nearly nonexistent in 2015. That difference and the political pressure on the Fed is a source of concern that the Fed may continue hiking rates to cool inflation under circumstances when it might otherwise have exercised patience (like in response to a fall in stock prices or other signs of impending economic weakness).
Bond Yields and Inflation Expectations. Having said that, inflation expectations as reflected in bond yields appear quite contained. Inflation as a subject of public concern has been with us since at least April 2021 when it first crossed above 4%. Despite headline inflation now more than double the level experienced through most periods since 1991, the movement upward in the yield on the 10-Year Treasury Note since the bottom in late 2020 is exceedingly modest. (See chart below to the far right.) While purchases of Treasuries by foreigners (who have even lower bond yields in their home markets) may partially explain low yields, the other likely explanations are (1) that the market expects that the Fed will be able to bring inflation to heel (perhaps mostly through supply shocks being worked off) and (2) that the economy will not for long grow at a rate that can accommodate higher bond yields (i.e., the bond market is expecting future economic weakness).
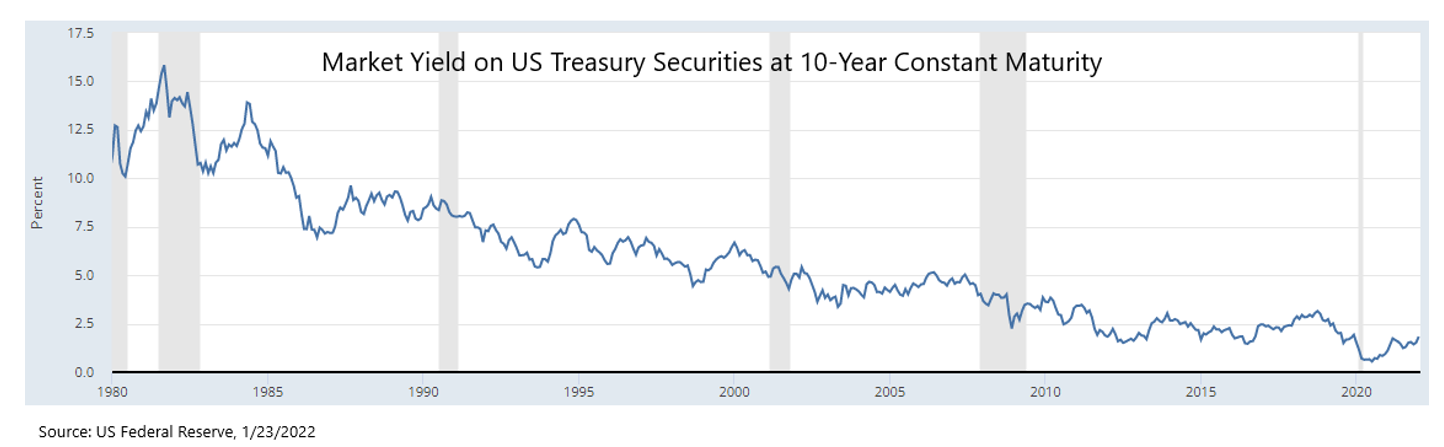
Other than weakness in certain consumer surveys—which may say more about dissatisfaction with the price of gas or the difficulty in purchasing a home or a new car—there are no notable signs of economic weakness. There have been some signs of cooler growth in December and early January as the Omicron variant took off and Covid protocols were reintroduced in some locales. But in general, financial markets seem to regard the US economy as being in a mid-expansionary phase. Thus, we see the yield on the US 10-Year Treasury Note as evidence of the likelihood that rates will top-out during the current hiking cycle at a low level, and that long-term deflationary pressures (evident in 10-Year yields over prior decades) will again be felt, such that considerable support for stocks will abide even if, as we expect, stock price multiples may continue to contract during the current hiking cycle. The degree to which such contraction may result in lower stock prices depends on the pace of corporate earnings advances, which appear favorable, if less dramatic than in 2021.
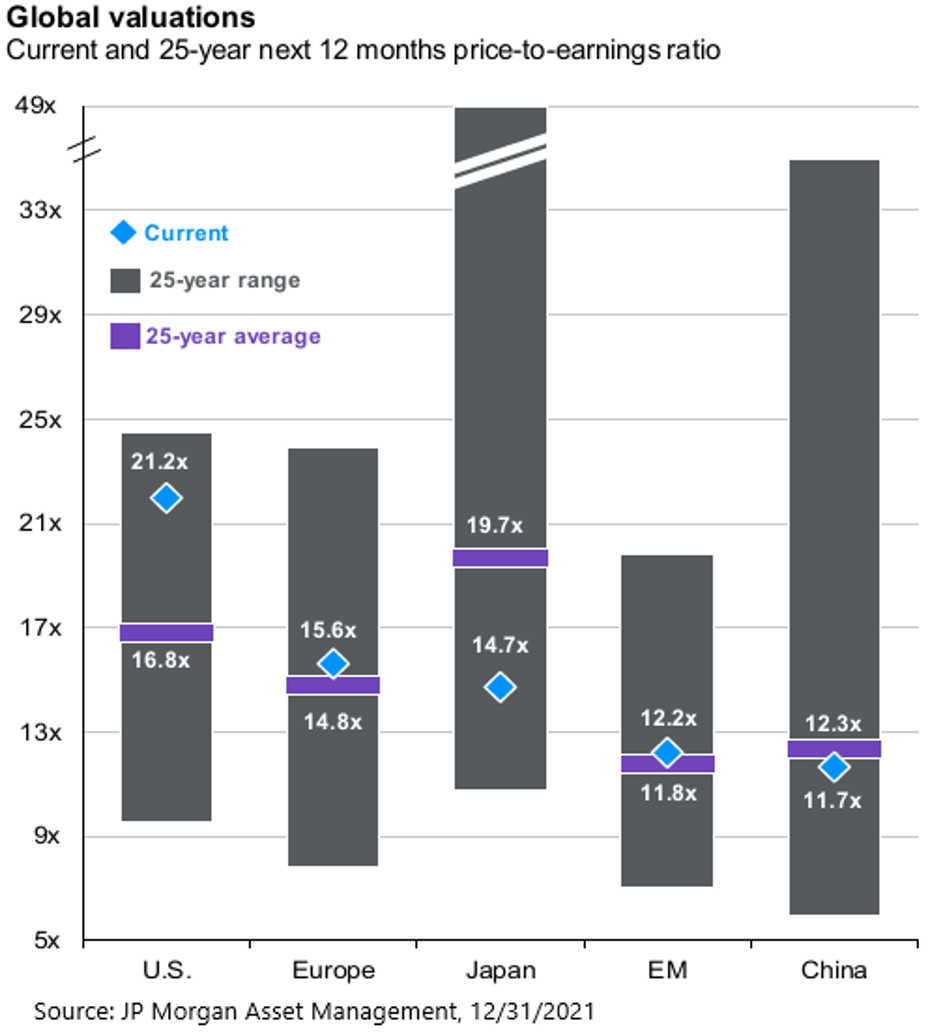
Opportunities in International Stocks. While price-earnings multiples have been high among US stocks for some time, valuations are more modest for developed international and emerging market stocks, which returned 11.2% and -2.5%, respectively in 2021. US stocks are usually more expensive than foreign stocks, but as shown in the chart to the right, the difference is much more pronounced presently than the normal relationship. Without writing extensively about these geographies, each of them is in the process of economic acceleration or repair, while the US economy will cool from the stimulus-induced growth of 2021 (about 5.5% real or 12.5% nominal). Thus, in geographically diverse portfolios such as those we compose for clients, we find there is more value present (and opportunity for future return) than may be believed simply from looking at US stock prices.
Seeking Low Duration and Better Yields in Bonds. As we’ve described in past newsletters, low bond yields are challenging in that the low yield provides a low absolute return from holding a bond, and the sensitivity of the market value of a bond increases as the yield is lower. Longer maturity bonds are also more sensitive to interest rate changes. Duration is the term for the standardized measurement of this interest-rate sensitivity. The yields and durations of various bond market sectors can be seen in the chart to right, as well as “Aggregate” as a shorthand for the Barclays Aggregate, the best-known broad benchmark of the US bond market.
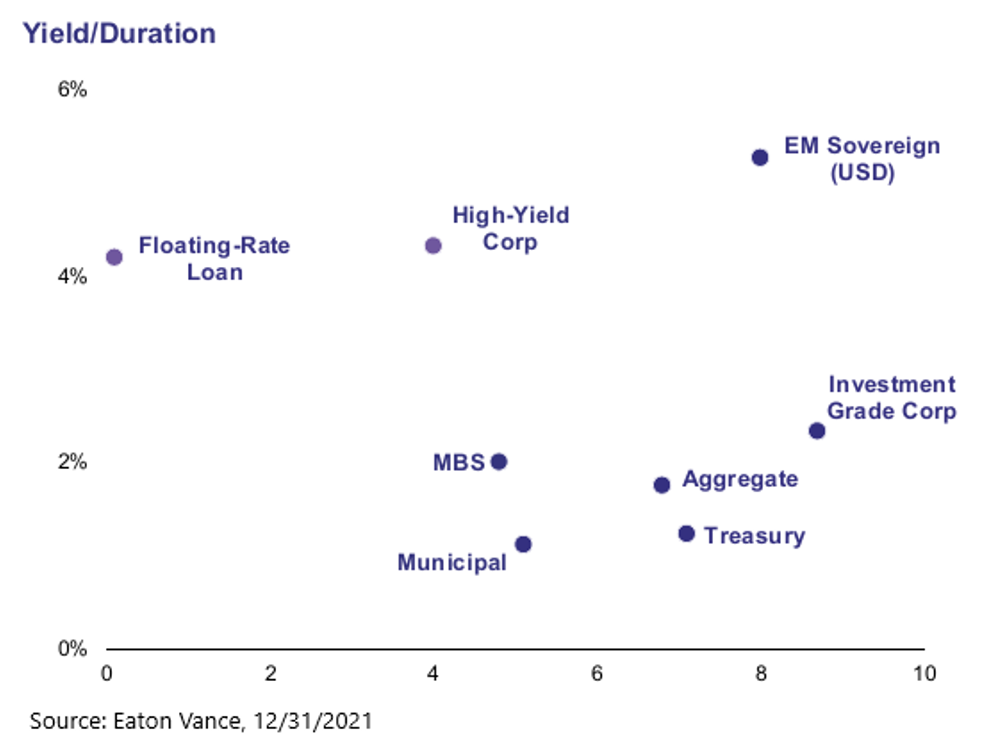
“Core” bonds consist of Treasury bonds, some municipal bonds, and mortgage-backed securities (MBS) issued by a US agency, such as Fannie Mae. Core bonds are an indispensable portion of diversified portfolios because they are the most reliable source of value that can be sold, and the proceeds used to purchase more stocks or other risk assets when they decline and to support a household during periods of market stress when trimming stocks would be disadvantageous. Unfortunately, core bonds don’t offer much prospect of current return at low yields and had a total return of -1.5% in 2021 as a combination of yield and price movement.
By contrast, we consider the other bond sectors “peripheral” and look to orient client portfolios toward better tradeoffs among current yield, interest rate sensitivity, durability and liquidity. For example, in August 2021, we significantly reduced client investments in corporate and high yield bonds due to our judgment that such bonds are sensitive to changes in stock prices (i.e., positively correlated), are increasingly sensitive to interest rate changes (as their duration lengthens) and offer only very modest yield pick-up over core bonds as compensation.
As you know from prior letters and rebalance conversations, we believe clients who can accommodate the volatility of publicly-traded closed-end funds or the illiquidity of private funds to hold floating rate notes can benefit from the better yield and duration profile of that sector. For example, floating rate loans as measured by the benchmark index returned 5.2% in 2021. We are evaluating still other alternatives to traditional fixed income bonds, where in return for illiquidity investors earn either higher yields than from traditional sectors or the opportunity for increasing yield. Some of these also may be attractive to clients who look for social-impact benefits from selective investments, such as lower-priced housing and renewable energy infrastructure.
We appreciate your trust and partnership and will be in touch with your planning needs and as market developments warrant. We hope the new year is off to a good start for you and look forward to seeing you soon.
Scott D. Benner
Cameron J. Barsness
Ryan V. Stevens