Whether we’ve been the driver or a passenger—perhaps as a child in the back seat on a family road trip—we’re all familiar with the question “How long until we get there?” Now, following the third consecutive quarter of market declines in both stocks and bonds amidst the Federal Reserve’s campaign to hike interest rates and cool inflation, this question is on many people’s minds. In this letter we seek to summarize recent market moves, put them in context with the Fed’s published intentions and describe the improved opportunity for investment returns as we survey with a horizon of five years or more. And of course, we highlight some uncertainties regarding events we may encounter along the way, even as we are confident in reaching the destination.
What happened?
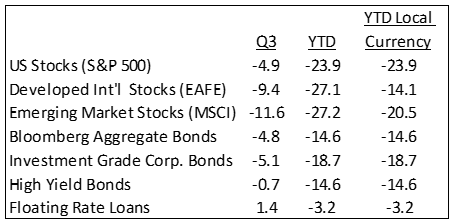
The cumulative decline in stocks this year has been substantial, but the even bigger story, as we’ll explain more (both as recent history and current opportunity), has been the speed and depth of decline in bond values. With US stocks, the biggest quarterly decline so far this year was a 16% drop in the second quarter, compared to a decline of “only” about 5% in US stocks in the just-ended third quarter. International stocks came into the third quarter holding up well, but were hit (in US dollar terms) by the rising greenback, the deepening of energy difficulties in Europe and the further cooling of China’s economy.
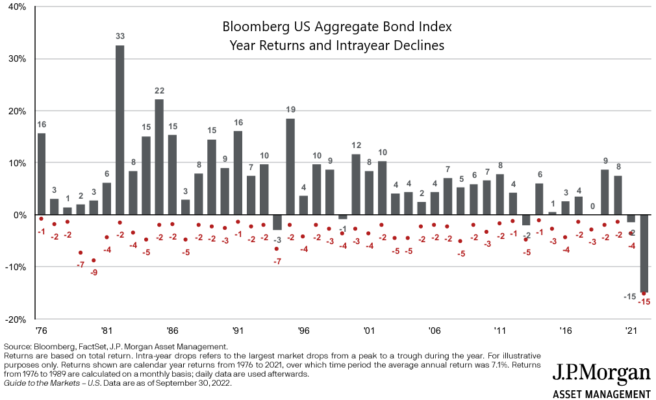
Clients may be accustomed to seeing from us illustrations of intra-year declines in stock prices versus the final number for the year, but below we present a similar chart for changes in bond values. As is true with stocks, some amount of decline in the midst of a year is an inevitable part of normal market variation, but notice the outlier at the far right of the chart, which represents the year-to-date decline in the well-known broad US bond benchmark, the Bloomberg Aggregate.
As clients know from working with us, we have moved over the past few years toward shorter duration bond mutual funds (duration is a measure of interest rate sensitivity), and last year trimmed out dedicated investment grade bonds and added floating rate loans to client portfolios where appropriate. As a consequence, most of our favored bond managers beat the Bloomberg Aggregate for the prior 12 months, some by substantial margins. Still, there is no escaping that bonds have contributed substantially to recent declines in client portfolios and thereby to diminished measures of annualized returns that are naturally coincident with a low point like now in stock prices.
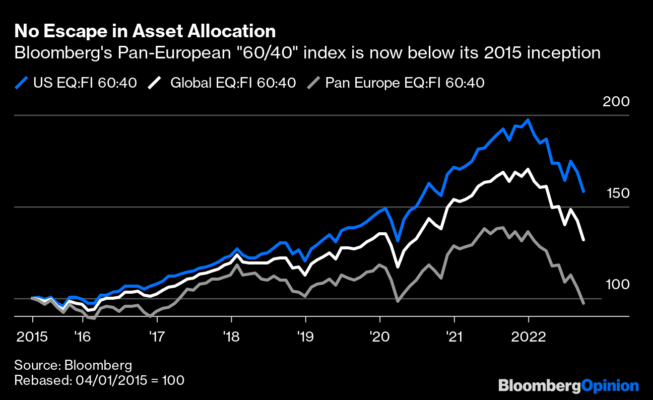
As a consequence of the combined decline in stocks and bonds, one can get the sense that asset allocation “didn’t work.” As an illustration, consider the image below that shows 60/40 stock-bond portfolios built with either US, global or European assets. Regardless of geography, the declines have been large, pushing portfolio values down to levels similar to 2020. While that result has been very unpleasant, it is a magnification of something quite normal: When the market moves ahead briskly (as in 2020-2021), investors end up borrowing returns from the future that they partially give back as markets normalize and decline. Then the cycle begins anew as markets recover. Viewed from enough distance, the upward trajectory of compounding returns can be seen. Also, as explained further below, management teams in our favored funds are orienting toward better value, so diversification is at play and working at a level not easily seen at the top level of a client’s portfolio.
How long will the pain go on?
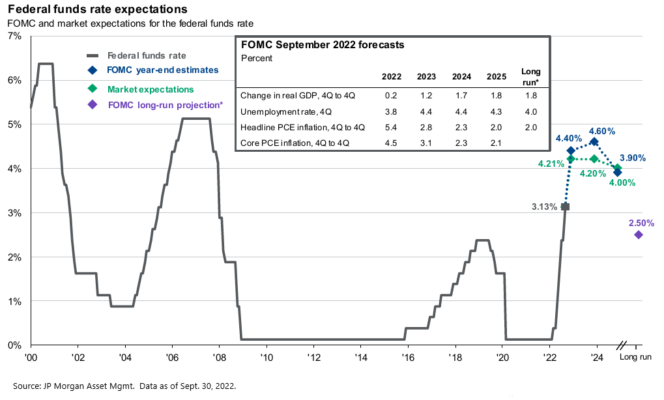
We’ve warned from the beginning of the hiking cycle that this is a process of adjustment that takes many months, even as we’ve become more salutary about the mid-to-long-term rewards of investing after the steep declines of the second quarter. As shown in the chart below, the Federal Reserve has hiked about three-fourths of the way toward its stated endpoint and will be nearly there by the conclusion of its December meeting. Markets are likely to be volatile (and indeed we may see more events like the UK bond selloff and recovery last week) until the Fed at least slows the pace of hiking to only a quarter-point per Fed meeting, as the Reserve Bank of Australia recently did, but this process will be extended the longer it takes for inflation to cool.
To give some sense of the scale and composition of core inflation (which excludes energy and groceries), the abatement of which is the Fed’s goal and mandate, we’ve reproduced the chart below.
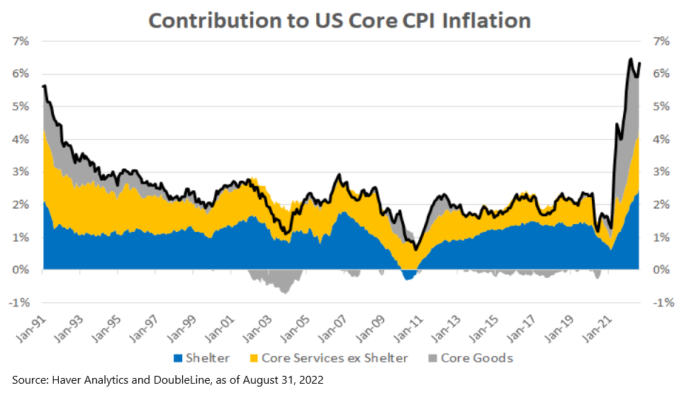
You can see that inflation from goods was essentially non-existent and sometimes negative (as measured by CPI) from roughly the turn of the millennium to the onset of the Covid pandemic, while core services have been a contributor all along. At the onset of the pandemic, while services were shuttered and consumers bolstered by greater income and cash balances from stimulus money, they accelerated their purchases of goods, driving that component of inflation upward.
In our prior letter, we mentioned that those contributors are starting to turn as supply bottlenecks decrease and consumer spending preferences shift back towards services. Shelter, on the other hand, which is a measure of actual rents paid by tenants and assumed rent that homeowners would pay if they rented, have likewise moved significantly higher since the pandemic. Thankfully, the pace of rent increase may have abated this late summer after spiking earlier this year, but it is still running around 7-8% annualized as of August according to an index maintained by Zillow. Still, rent is likely to remain an elevated contributor to core services for a while.
What can I expect longer term?
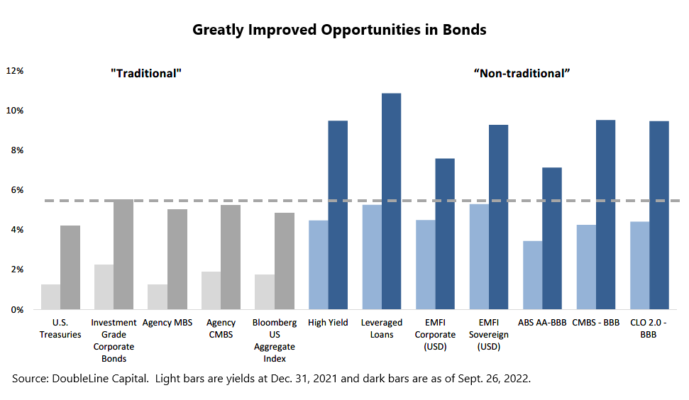
Although the general selloff in bonds has created limited opportunities for a large bond-for-stock trade, bonds as an asset class now offer returns that are truly meaningful. As shown in the chart below, bonds offer yields across a number of sectors that have been absent since the introduction of the “zero interest rate policy” instituted in the wake of the Global Financial Crisis. The illustrated dramatic increase in yields from year-end 2021 to the near-present largely explains the historic decline in bond values year-to-date. Accordingly, our favored bond managers are reorienting their funds toward better value, especially toward higher quality bonds that are held in securitized pools that require specialized knowledge and significant teams to evaluate. From our calls with them, they are also looking to add corporate credit and high yield bonds as stress is further exhibited in markets.
And reallocating portfolios as we are within and among sub-asset classes is incrementally reorienting them to better value, such as between longer- and shorter-term bonds, between growth and value stocks and between US and international stocks.
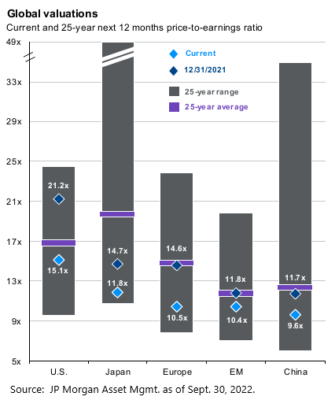
The retreat in stock prices has pushed US valuations somewhat below average valuations of the past couple of decades as shown in the chart below. Consequently, investments in US stocks represent opportunity for return at a scale that has been missing for some time, even as the economy and companies will face inevitable challenges, especially in the short term as the economy cools and likely heads into recession. And foreign stocks have moved from a better value relative to US stocks at the year start to near historic low valuations at the end of the third quarter. As one measure of value, dividend yields on the international EAFE benchmark stocks are nearly double (3.47% vs. 1.75%) that of the US S&P 500 and emerging market stock yields are two-thirds more than those in the US market.
These cheap foreign stock prices coincide with a triumphal US dollar that looks ripe for reverting into decline when the Fed halts its rate hikes due to the US’s weak fiscal and trade balance.
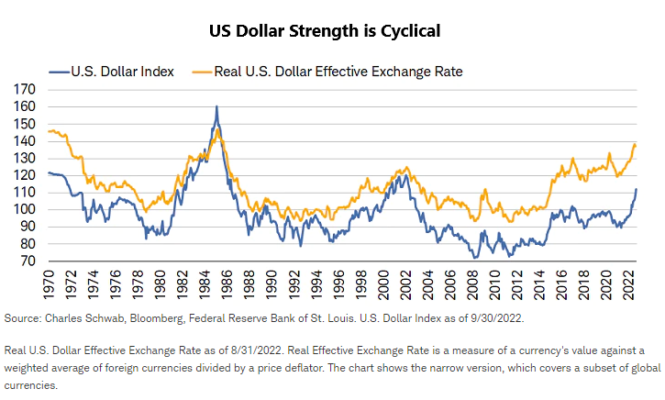
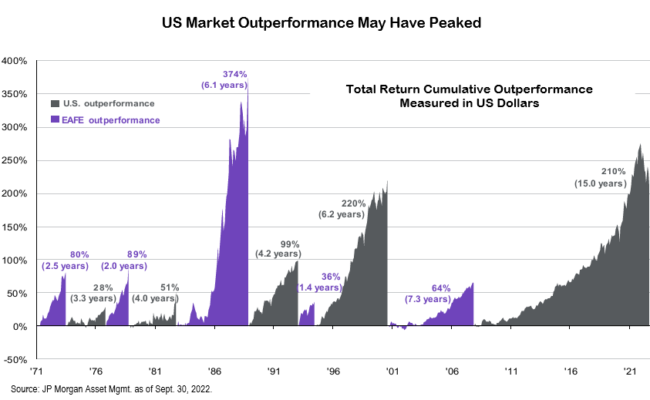
Prior to the current run of the dollar, US stock outperformance had seemed to have peaked as shown in the chart below. Even with amazing dollar strength, foreign markets have been doing remarkably well, in comparison to the normal expectations of blow-ups such as the Asian currency crisis of 1996-97, perhaps because central banks of the emerging market countries started hiking interest rates ahead of the Fed. As shown in the chart at the outset of this letter, foreign markets have outperformed the US year-to-date in local currency terms, and what near blow-ups that have happened as financial conditions have tightened—the UK crisis, for example—have not been in the emerging markets.
In addition to reflecting on these major relative value distinctions, our investment management team is constantly re-evaluating how our portfolios are constructed and looking for opportunities to streamline exposures while simultaneously looking for additional idiosyncratic investment strategies that could play a role. Examples include alternative credit funds that are available to a wider set of clients and allow the manager a greater degree of latitude in management to capture opportunity and dedicated funds for investing in secondary purchases of private equity as pension funds rebalance their portfolios following the public markets selloff.
Beyond this investment management work, we enjoy and are dedicated to counseling clients through the financial segues of life (e.g., business transitions, retirements, inheritances) while putting the recent market pullback in context through our regular financial planning and reporting. Our team welcomes your questions and conversation and looks forward to speaking with you soon.
IMPORTANT DISCLOSURE INFORMATION
You should not assume that any discussion or information contained in this newsletter serves as the receipt of, or as a substitute for, personalized investment advice from KBBS. To the extent that a reader has any questions regarding the applicability of any specific issue discussed above to their individual situation, they are encouraged to consult with the professional advisor of their choosing. KBBS is neither a law firm nor a certified public accounting firm.