
One metaphor for the path of financial markets in the recently-ended third quarter is a unsettling car ride where the driver must navigate between the threat of AI-based excesses (e.g. high valuations; market concentration) on the left and rising interest rates (and related threats to valuations) on the right. This situation puts your author in mind of a vivid ride in a rented minivan with my adult son driving the family on a two-lane highway through the mountains west of Palm Springs following a family reunion. My vantage point from the back seat gave a gut-turning view of the sheer drop to the left each time my son maneuvered past slower cars (or tried aborted attempts!). My daughter, riding shotgun, was unfazed, having become accustomed to her brother’s driving by riding with him to high school.
So much depends on one’s aperture of considered context: Interest rates are pretty normal by historical standards despite the marked difference between long-term historical norms and more recent common expectations formed during the zero interest rate policy era of 2008-2022 (“ZIRP”). And the concentration of stock market returns among a smallish set of leading companies is the norm, even if the present circumstance is more pronounced.
The Composition of Interest Rates. To take the matter of interest rates first, rates have been rising throughout the year and advanced more quickly during the third quarter. The rise has been attributed to persistent inflation, a more quickly growing economy (especially for the build-out of data centers) demanding more capital and increased government borrowing. The effect on government bond yields in particular has become a matter of increased concern, which we address at some length below.
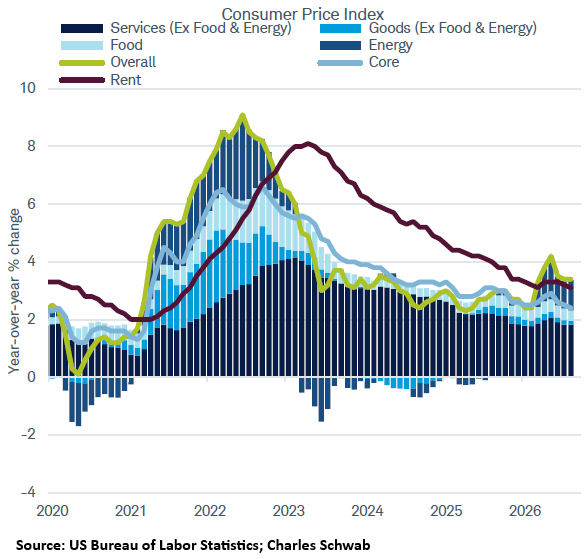
Inflation has been all too evident to all of us the last several years, although in general it had been trending down until energy prices spiked with the war in the Persian Gulf. Having said that, most of inflation is buried in the services we pay for—travel, insurance, personal care, etc.—as shown below, which is why it is slow to abate. Services inflation has been significant for decades, but the effect was dampened by flat or falling prices of goods as supply chains globalized. That dampening effect essentially stopped with the US-China trade relationship becoming openly adverse. In addition, services inflation took off with the recovery following the Covid pandemic and has been very slow to abate. Thus, inflation is likely to remain prominent and supportive of higher nominal interest rates.
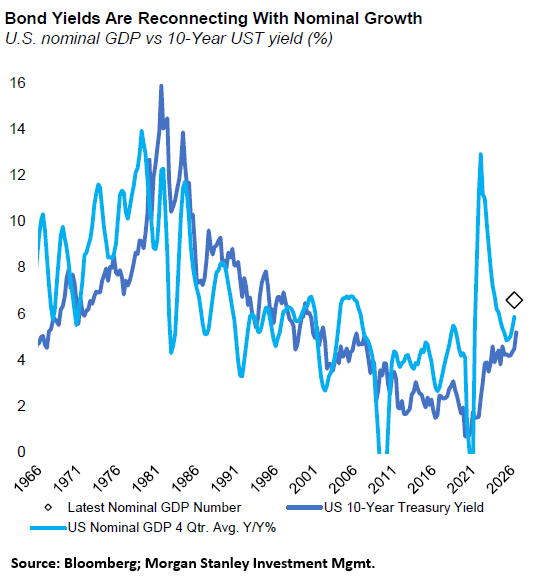
The unremarkable level of current interest rates when viewed with a longer lens, and the relationship of higher interest rates to faster economic growth (as we are currently experiencing) can be viewed in the chart below. Rates rise as a more briskly growing economy demands more capital for investment, although the chart below also includes the effect of inflation since interest rates are shown on a nominal basis without subtracting for inflation.
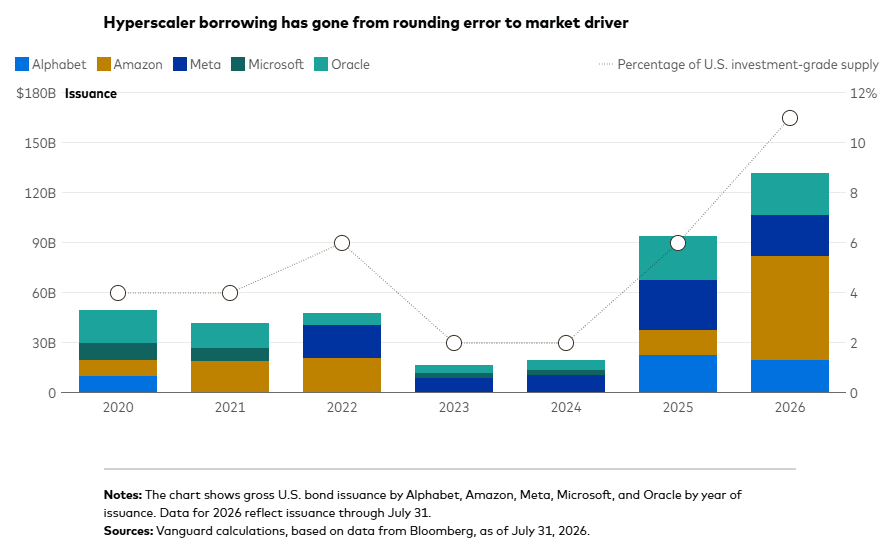
Rates are also rising because the supply of bonds is growing. Part of that is due to poor government finances, addressed below, but some is due to the borrowing needed to build all the data centers that companies believe are necessary for the provision of AI-related services. The pace of increase in this borrowing can be seen across the years in the chart below. And the total amount of current borrowing by the “hyperscalers” has become a major portion of new corporate bond supply as shown in the right-hand scale.
Government Funding Needs. The growing supply of government bonds is due to excessive budget deficits in the US and many Western European countries. Members of that group are challenged generally by inadequate revenue to fund expensive entitlements, greater defense demands, and the transition to renewable energy. For Europe the context also involves taxation that is already high and deteriorating demographics that contribute to slow economic growth. With the notable exception of the Nordic countries, Germany and the Netherlands, most Western countries have debt levels approaching or above 100%.
During the third quarter, rising yields for government bonds garnered significant media attention. French bond yields have spiked as investors assess a situation where no parliamentary leader can seem to get traction with budget reform, the candidate leading in polls for the coming presidential election promises the French people earlier retirement (age 62) and protests and rioting have engulfed the country, initially over inadequate education. The situation is reminiscent of the short (44 days), unhappy leadership of Liz Truss as UK prime minister when the bond market revolted in response to her party’s mini-budget promising tax cuts and energy price guarantees. The Bank of England was forced to intervene with purchases of government bonds when spiking yields threatened the solvency of British pension plans.
These episodes should be instructive for us to address our own public finance challenges here in the US. In terms of math, the scale of the US annual federal budget deficit is significant (6% of GDP) but solvable. US federal debt was near the current level following WWII and was brought down through budget surpluses made possible by high taxes, a growing economy and (until 1951) Federal Reserve purchases of US Treasury bonds to keep interest rates low. In our present case, the initial challenge is to stop the growth of accumulated debt as a share of GDP. That probably requires about 3% of GDP in some combination of tax increases or spending cuts. Doing that all at once would bring on a recession, but a plan to phase those changes in over a handful of years would likely work, if the plan can be maintained politically.
When will we find the political will to address our public finances? The policy direction of the energized elements in our two major parties is not encouraging. Meanwhile, the recent US Treasury repurchase of 30-year bonds (funded with new shorter-maturity issues) is merely a modest attempt to check the speed of market adjustment in yields on longer bonds.
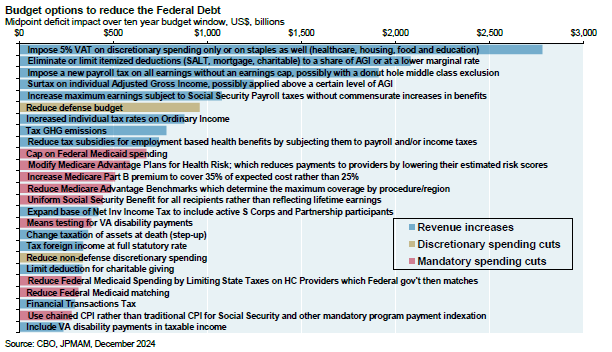
For more detail on the topic, including a list of policy choices and consequences prepared by the Congressional Budget Office, please see the Appendix at the end of this letter.
Implications for Bond Investing. The relative weakening of US Treasuries (and most Western European sovereigns) is significant for portfolios but less so than might be expected. This is due to the proliferation of bonds backed by mortgages, various receivables and a greater and greater variety of assets, most notably as of late, semiconductors in data centers. Consequently, financial institutions who need investment grade fixed income securities for their portfolios have a greater and greater variety of choices. For reference, among the three “core” bond funds used as the most durable assets in client portfolios, the percentage allocation to US Treasury and agency debt ranges only from 12-25% currently and was near zero at times during the ZIRP era. Through deliberate selection of particular sectors and credits, our preferred managers have done an admirable job of navigating the pitfalls in the Treasury market and taking advantage of higher yields that contribute to client portfolio income.
Despite the investing flexibility available to our preferred managers, it must be said that the pace of climb of sovereign bond yields this year has been unsettling at times for the market generally. Bond values move inversely to yield as a matter of simple mathematics (other than for floating rate debt), so rapid movements can create trouble for balance sheets when valuations diminish faster than the bondholder collects interest payments.
Stock Valuations and Interest Rates. Interest rate movements also affect stock prices, and the rise in rates likely played a role in diminishing the valuations of stocks, even as the US market advanced 2.3% in the third quarter (for 12.7% year to date) as measured by the S&P 500 Stock Index. We say stocks became less highly valued because reported corporate earnings grew much faster (30% year-on-year, excluding AI special investment gains) than stock prices rose in the third quarter. Thus, each dollar of earnings was less highly valued by the market. This is visible in the chart below with the blue line moving down and corresponding to a lower price-earnings multiple on the left-hand scale. The US Treasury 10-Year yield, inverted on the right-hand scale, is presented to demonstrate the relationship.
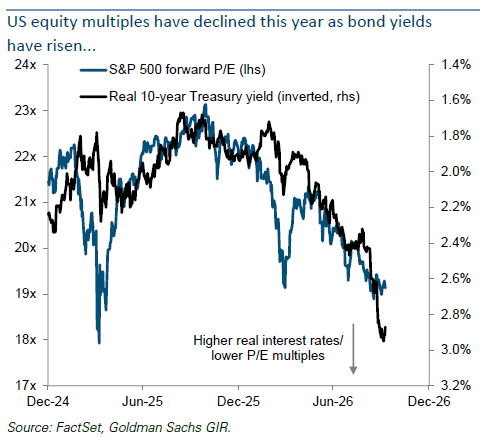
We view this development favorably as it represents a rational response by markets to the comparative offering of higher bond yields and to the challenges that higher rates pose to companies more dependent on borrowing to fund their balance sheets. For example, lower starting stock prices (measured by price/earnings ratios) are associated with better long-run returns from stocks.
Despite the modest advance of US stocks during the third quarter, as measured by the S&P 500 Stock Index, the prices of individual company stocks churned significantly. Some of that is normal (that’s why stock portfolios need to be diversified), but the pace of churn was heightened (26% decline at some point for the average stock), as the market assessed which companies were most affected by interest rates. Small cap companies, for example, are more highly dependent on borrowing, and the results showed in a 7% drop in US small cap stocks during the quarter.
Also, during the quarter, market participants increasingly sought to make sense of the differences among companies focused on the AI data center boom. And this focus will likely increase in coming months and years as the AI theme plays out. For example, privately-owned AI lab Anthropic reported revenue of $16.8 billion in the third quarter, up 45% from the prior quarter, and is looking for a $2 trillion valuation at IPO this year. Sparkling as those results are in an industry that came onto the scene less than four years ago with the release of ChatGPT, the pace of growth was a slow-down from the prior quarter.
By contrast, OpenAI, which has a business slightly behind Anthropic in dollar volume, has decided to delay its IPO to next year. Although the whole AI industry’s funding model resembles a bowl of spaghetti, OpenAI’s commitments and funding sources are a notable tangle that have created doubt among a variety of commentators about their ability to meet their obligations. In simple terms, OpenAI needs to grow very fast, and it has presumably delayed its IPO to try and realize that growth in order to make its IPO a more likely success. That is a notable step in that one would expect that there is tremendous incentive to raise money now before the growth story in AI cools. Likewise, CoreWeave, a so-called “neo-cloud” company that formed not long ago and is racing to build out data centers, found itself cut off from the bond market as a result of concerns with its business model. These steps toward discernment in the AI space are a welcome development.
Even so, this pace of tens of billions of dollars of quarterly revenue for AI labs is made possible because companies are starting to spend significantly to use AI to do real work. Four times more AI power (measured in “tokens”) is consumed by agentic agents (programs that take action steps and build deliverables without further user prompts) versus AI power directly consumed in response to a query from a human user. This after only about six months since AI labs started offering agentic capability.
Consequences for Client Portfolios. We have attempted to deal with the momentum in the AI theme in part through allocations to US large cap index funds (to have the benefit of that theme) and to diversify away from it through other positions that tilt toward company quality of earnings, favorable stock pricing and somewhat smaller company size. We have been pleased with the results of that approach, which has tended to dampen the swings in client stock investments during a period of notable volatility the past few years starting with President Trump’s launch of tariffs against all trading partners, continuing through the war in Iran and to the present, more discernment in the market’s approach to AI company valuations.
Of course, investing internationally is also part of our approach to spreading risk. But even there, care must be taken to reduce reliance on a small number of companies, many of which are also related to the AI theme, including Hynix, Samsung and Taiwan Semiconductor in emerging markets and Schneider and ASML in the Eurozone.
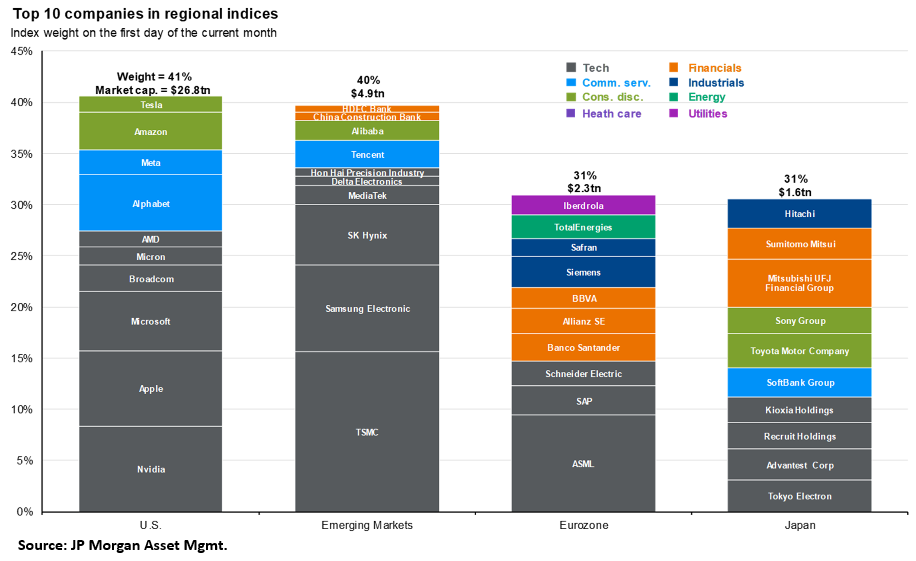
Thus, we continue to adjust client investments outside the US from distinct geographic buckets to a more general ex-US company stocks category, where concentration is less acute. We also employ funds with a low-cost factor approach to emphasize quality, company size and valuation and another fund that takes a value-based approach focused on expectations of durable advantage.
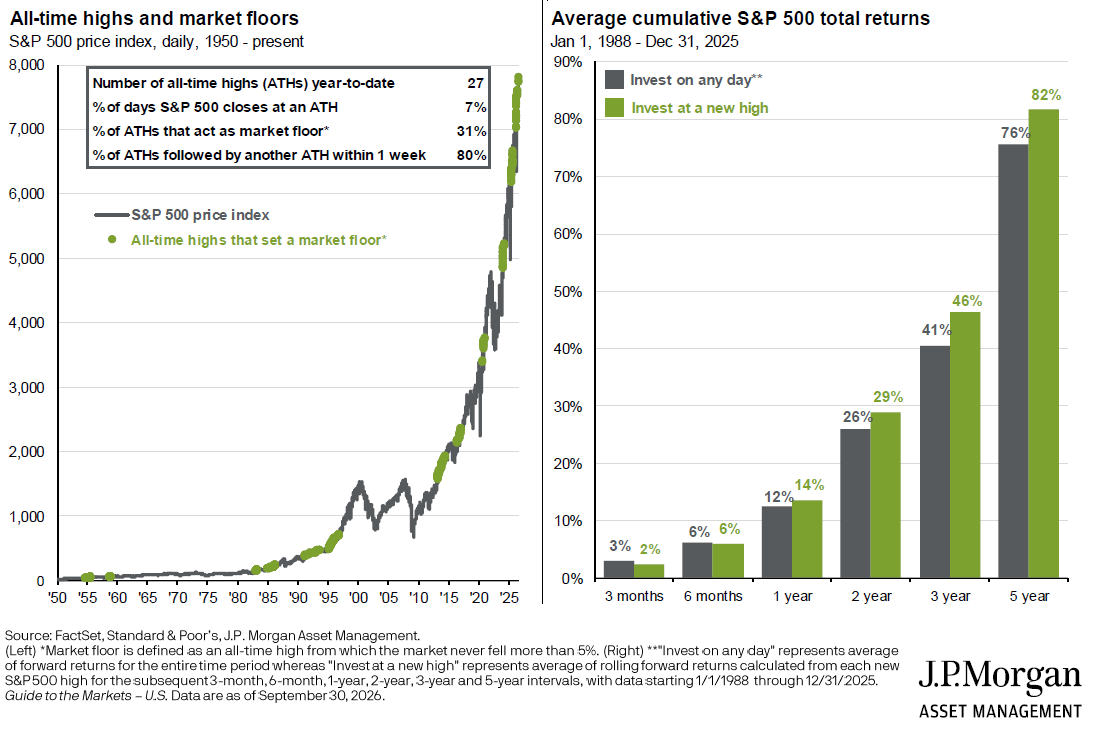
It is worth remarking that even while major themes can bring a sense of trepidation while stocks advance, stocks are said to “climb a wall of worry.” The stock market advances over time despite ever present concerns, so a sequence of greater highs, separated by retreats, for sure, is the norm. In fact, investing following a new advance in stocks prices has not really hurt, on average, and sometimes has helped the average of results over subsequent periods.
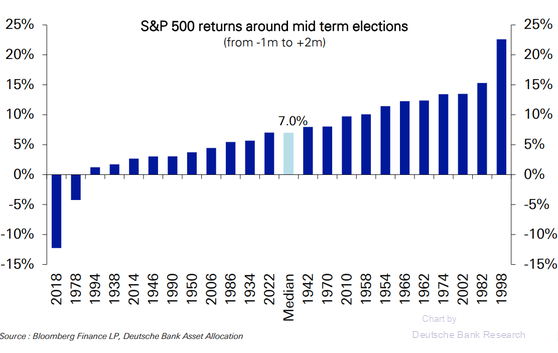
Finally, with voting already underway for mid-term elections, it is good to be reminded that markets tend to advance with a growing economy regardless of who or what party is leading the nation. Below is a chart of US stock market results from a month before to two months after mid-term elections going back to the 1930s. As you can see, historically the period does not present any cause for worry about stocks.
* * *
We wish you the best as the holiday season starts coming into view. We will be in touch as needed regarding year-end financial planning matters. If there’s something you’d like to discuss, including the topics in this letter, we’d be delighted to hear from you.
Appendix: A Thumbnail Summary of the US Fiscal Deficit and Policy Choices
The US federal deficit (including payments on the debt) is about $2 trillion, or 6% of GDP. So long as the deficit is larger as a share of GDP than GDP growth, then the debt is growing as a percentage of GDP. GDP may be growing at about 6-7% on a nominal basis in the current quarter (see Atlanta Fed GDP Now plus inflation), but generally the US economy is expected to grow about 2% on a real basis (which is how it is reported by the government and in the press) and the Federal Reserve’s inflation target is about 2% as well, meaning 4% is a common long-term nominal growth expectation. Thus, the accumulated debt burden is expected to grow at about 2% per year as shown in the chart below.
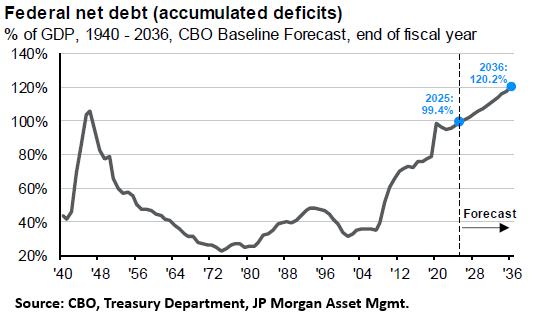
Thus, to stop the growth of the debt as a share of the economy and to give ourselves the space to reduce the accumulated debt, we need to close the gap by about 3% of GDP or $1 trillion per year. That couldn’t be accomplished all at once without creating a recession, but a plan to reduce the deficit by a half percent or so per year for six years could work.
Compared with Europe, our federal government revenues are much more dependent on a small number of high-income taxpayers to support a less expansive welfare system. Consequently, there is substantial room to add revenue by closing tax loopholes, means-testing major benefits and widening the tax base to a greater number of taxpayers, either through higher income tax rates across all levels of income, or, like in Europe, a value-added or carbon-based tax that applies at each level of production and is ultimately borne by the consuming public and the owners of businesses.
Below is a chart of the major tax and expenditure policy choices prepared by the Congressional Budget Office in 2024 and reproduced graphically by JP Morgan. The revenue of each choice is stated in dollars gained over the CBO’s standard 10-year forecasting horizon. Thus, the goal of 3% GDP improvement in the deficit involves about $10 trillion over the full period.