The fiscal quarter that ended September 30 was supposed to be the off-ramp to normalcy for the economy. It now seems a long time ago, but early summer 2021 was a time of low Covid case counts and great optimism.
(We pause here as you, our reader, may sigh upon thinking this is another story about Covid. It isn’t really. But to talk about what happened to the economy and markets in the third quarter and to write about where they may go from here, we must take cognizance of some essentials about Covid. As a matter of necessity, we write about events and data in the aggregate, and acknowledge that each of us has had very personal experiences with the pandemic and has observed effects on family, friends and others.)
As the quarter opened, many companies, including us, were planning to be in the office on their modified full-time schedules after Labor Day. That would also mark the start of the academic year, which should have allowed parents, especially mothers, who had dropped out of the labor force or worked only part time, to return to full-time work, buttressing the labor rolls. Instead, the Delta variant of Covid arrived, bringing a new crescendo of infection concentrated among the unvaccinated. Then in late July, data emerged presenting unmistakable evidence of transmission among the vaccinated public. The CDC and public health authorities in much of the country renewed their social distancing and masking mandates, which remain with us today.
Although growth was going to slow anyway from the torrid pace of reopening and third round of stimulus spending earlier in the year, the slowdown from the Delta surge was remarkable, from 6.7% GDP growth in the second quarter to 2.0% in the third. Backing out imports, exports and changes in inventories, real final sales to domestic purchasers (“stuff that got sold, inflation adjusted”) were essentially flat. Major stock indexes went nowhere for the quarter. The one exception was the 8% decline in emerging markets stocks, stemming principally from the tumult in Chinese markets. Bonds were likewise essentially flat for the quarter. For the year through September, however, returns have been very strong for US stocks (16%), good for developed international (9%), about flat (-1%) for the emerging markets stocks and somewhat negative (-2%) for bonds.
Current Economic Environment
Fast forward to the present: here in Washington state we have slid about halfway down the back side of the Delta epidemiological curve. Vaccinations are now available for children age 5 and above, who are back in classrooms. Booster shots are approved for everyone and generally available.
As cited by David Leonhardt of The New York Times in his November 12 article “How Does This End?”, daily hospitalization rates of Covid in Seattle for vaccinated persons are now one per million residents, while typical hospitalizations from seasonal flu are two per million. He observed as follows:
The bottom line is that Covid now presents the sort of risk to most vaccinated people that we unthinkingly accept in other parts of life. And there is not going to be a day when we wake up to headlines proclaiming that Covid is defeated. In many ways, the future of the virus has arrived.
We share this not to invite a debate over public health guidance, but to acknowledge that when the principal Covid reporter for the “paper of record” writes such things, it is a signpost of something, if only a noticeable departure from a general tenor of concern the past 18 months. Thus, it begs the question, “where are we?”
Generalizing greatly, we are working our way through an economic period characterized by “supply chain bottlenecks,” a reduced labor force and robust consumer buying power due to fiscal stimulus and housing and stock market gains. Bear with us as we describe this economic posture with some charts that illustrate the magnitude of change the economy is undergoing.
To get a sense for how dramatically household finances in the aggregate have been augmented by fiscal stimulus since the pandemic started, consider the chart below of real disposable personal income. The three big spikes to the right are the effect of the three Covid stimulus bills. By comparison, the tiny tooth to the far left shows the effect of stimulus adopted in response to the Global Financial Crisis (“GFC”).
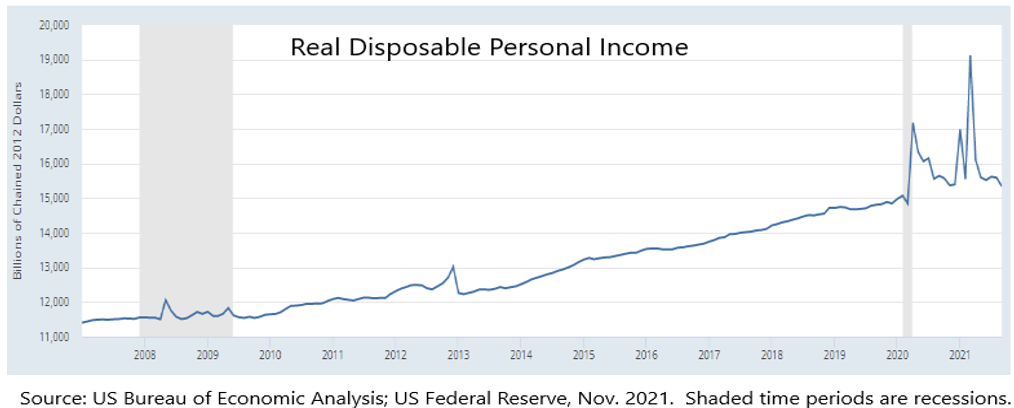
The GFC was characterized by weak consumer demand as households had to work off a housing-enabled debt binge. Arguably, consumers could have used more help 10 years ago, which might have increased demand and allowed the economy to grow faster. By contrast, consumer and policy responses to the Covid pandemic were to shun or shutter businesses, a supply contraction. With Covid, Paycheck Protection Program loans to small firms (which were largely later forgiven) helped to keep them intact so they could remain open despite reduced business. And supplemental unemployment compensation helped many fragile households pay their bills, although maybe at some temporary cost to the size of the labor force. But stimulus checks issued to employed or retired Americans simply buttressed consumer savings or meant more money chasing a smaller number of goods, the classic description of how inflation gets started.
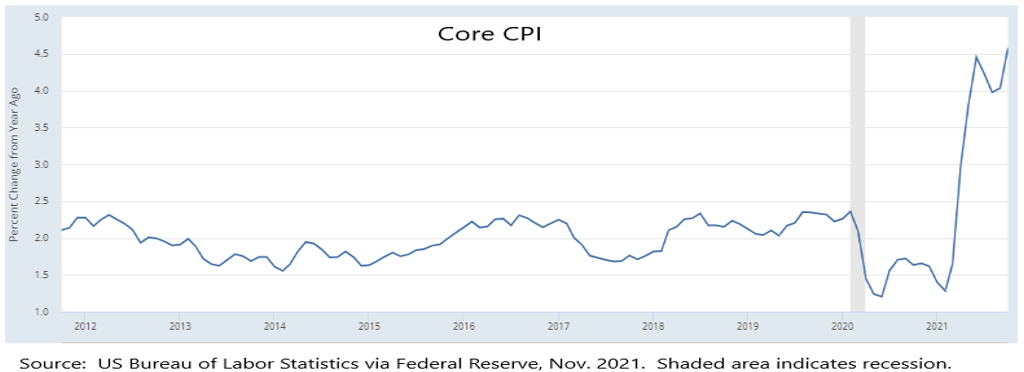
Indeed, prices are moving upward. The chart below shows so-called “Core CPI,” which omits food and energy (volatile components) from the basket of priced goods and services. The acceleration of inflation is obvious in the right of the chart. Comparisons to prices a year ago were bound to show marked increases because many prices fell last year when the economy contracted (so-called “base effects”). And we noted in our second quarter investment letter the very long-term trends (e.g., demography, innovation and trade) that have been deflationary. Nonetheless, we also noted the chances that as a country we seemed to be taking with inflation. With the passage of six months, there are increasingly evident reasons why it seems inflation may not be transitory.
Whether inflation will stay at its current brisk pace depends in part on whether wages will rise to support consumer purchases. That in turn depends to a great extent on the availability of labor and the level of wages necessary to attract workers. Shown below is the Atlanta Wage Growth Tracker, which is based on interviews with a consistent cohort of workers, as opposed “average hourly earnings” in Labor Department monthly job reports, which is skewed by demographic changes in the labor force and a more volatile survey. In the far right of the chart can be seen a movement higher than the 4% ceiling since 2016.
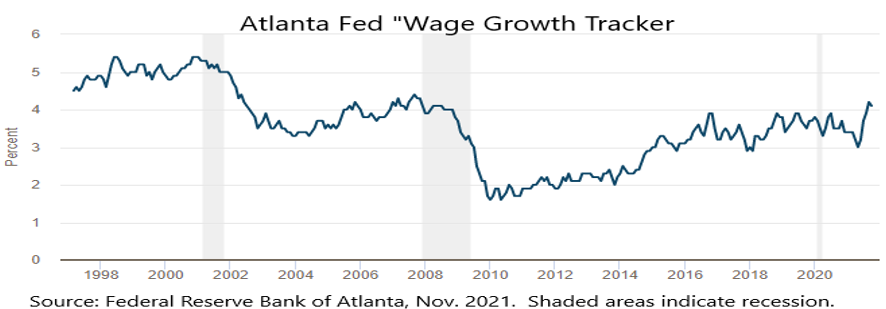
It will bear watching whether the recent uptick in the rate of wage growth is an aberration or the start of a sustained faster pace. Certainly, the Fed, which recently announced a reduction in the pace of its purchases of debt securities, has said it is watching the labor market for signs of sustained inflation, which could cause it to accelerate such tapering and bring forward the first interest rate hike this cycle.
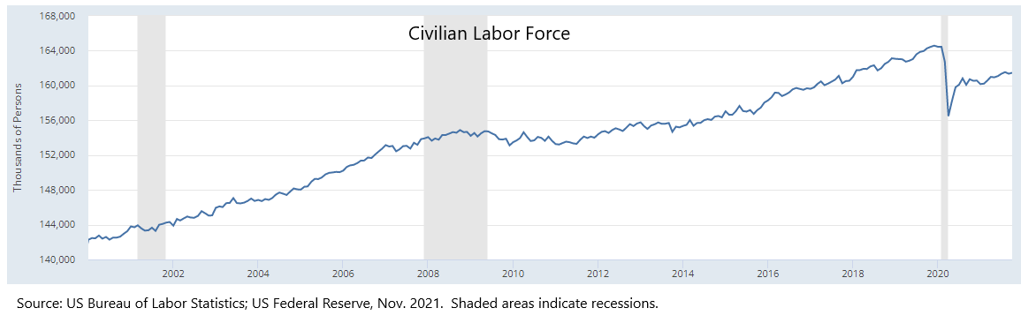
The good news in the labor market is that the official unemployment rate is already low at 4.6% (it was 3.5% before the pandemic). But that only measures the percent of workers who are out of a job and looking for work. Compared to prior recessions, a disproportionately large number of workers have dropped out of the labor force so aren’t measured in the foregoing statistic. The chart below shows a scale of decline in the labor force unlike anything we’ve experienced previously. Notice how the labor force didn’t change substantially during the two most recent prior recessions.
A combination of quits together with employer needs has put the ratio of job openings to unemployed (1.5:1) at the most favorable level for workers in generations. The only age group taking advantage of this environment are teens, whose labor force level is back where it was prior to the pandemic. Labor force participation is most depressed among those age 55 and older, who have a rate of participation (38.4%) that is only 0.2% better than the worst level recorded since the pandemic began. Presumably, these persons are more difficult to coax back into the labor force than younger workers. (As financial counselors, we hope that older workers who recently dropped out of the labor force are financially ready for retirement or whatever hiatus from work they are planning.)
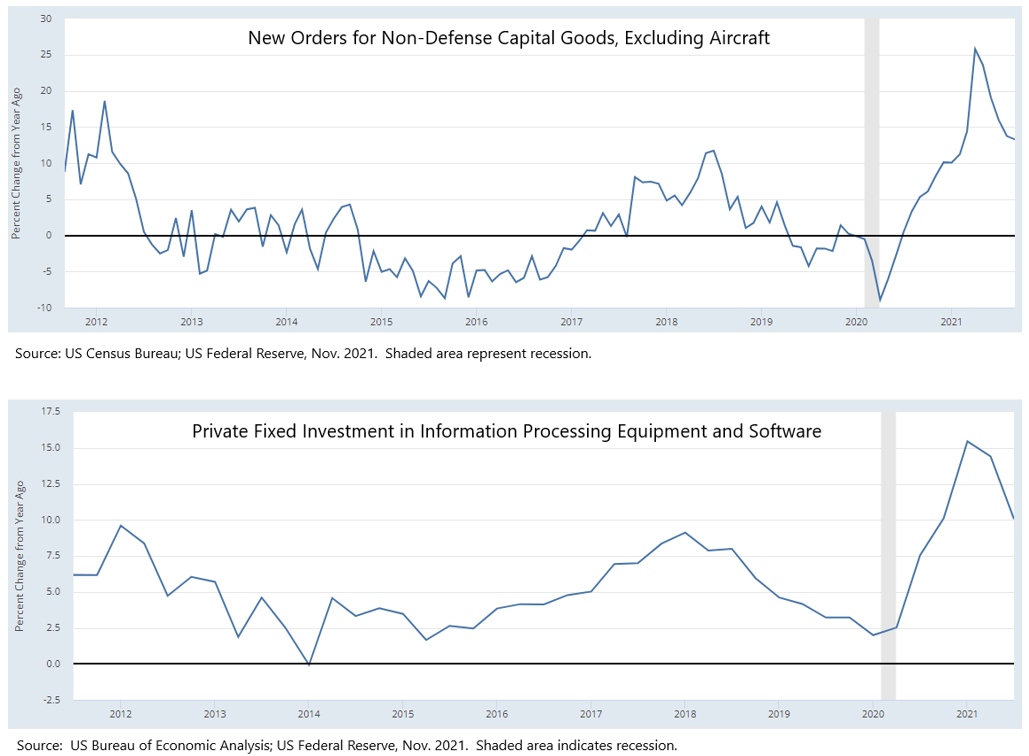
As the economy reopened and companies found it difficult to obtain sufficient workers, firms increased the pace of investment in their businesses. Below are charts for two popular measures of corporate investment. The first is manufacturers’ new orders for capital goods, but it excludes defense purchases and civilian aircraft, which are noisy elements of the data set. Think of this data set as measuring investments in machinery. The second chart is of private fixed investment in computer hardware and software. This measure also excludes government investment and captures at least part of companies’ investments in data and automation. Note in both cases the strong increase in the rate of growth after the initial drop associated with the Covid recession. Although growth is down from its peak in the last couple of readings, the pace of growth is still above the rate that prevailed most of the last 10 years.
These investments bode well for future corporate growth and profitability and also for labor wage rates because historically productivity increases are a prerequisite to sustained wage increases. Wage growth was stagnant for much of the post-GFC period and corporate capital expenditures were also subpar.
Planning Efforts & Financial Portfolios
Our financial planning practice is focused on the blocking and tackling of helping clients stay financially fit through regular examinations of cash flow, taxation, asset management, insurance and estate planning, as well as by helping clients navigate important financial events. Given the proliferation of change in life for all of us since the pandemic began, and strong financial markets creating liquidity events, the practice has been robust.
For a time, it appeared that significant tax changes might occur this year in conjunction with federal legislation. That is increasingly less likely, but we are keeping an eye on the situation. The infrastructure bill that President Biden signed into law doesn’t contain any significant tax changes. The Build Back Better bill has a host of tax changes that for a time were in daily flux. As of this writing, the House Democratic leadership has returned a variety of programs favored by Democrats that had previously been removed in hope of swift passage in the Senate. Instead, it now appears that if a bill passes the Senate at all it will not be the House bill and instead the process will have to go through a conference committee of both House and Senate members to work out a compromise in the manner legislation normally proceeds. Whether that process can be finished before Congress’s holiday recess is much in doubt. Stay tuned.
Looking at client investment portfolios, we believe that clients are well positioned for a variety of economic outcomes. The prospects for inflation are related to the prospects for increasing interest rates, and we’ve been working for some years to keep the bond portion of client portfolios positioned to better handle an increase in rates. Most recently, we reduced risk in bond allocations by eliminating a particular investment in the corporate/high yield area in favor of more core bonds. We’ve also added allocations to floating rate corporate loans where client qualifications and investment policies would accommodate the unique structure necessary for prudently making those investments.
Among stocks, we believe the largest weight in US large cap stocks to quality companies helps to control risk arising from economic change. These companies tend to have pricing power to help them maintain profit margins in the face of rising costs. (Hopefully, your participation as a shareholder/investor is some comfort as you feel the pinch of higher prices.) Our growth stock managers have performed well for some time, and the pace of technological change has not slowed down. Some market prognosticators assert that growth stocks perform poorly in the presence of inflation. We note with humility that the relationship between asset classes and economic events can change over time. Despite recent concerns about inflation, the IPO market, which is dominated by growth-oriented, loss-making companies, has been very robust. Perhaps some investors, fearful of the corrosive effects of inflation, seek growth to make up for it, rather than resorting to “value” stocks that are typically of older companies more tied to changes in the pace of economic growth. In any event, our value managers have likewise performed extremely well since the onset of Covid as the indiscriminate selloff in early 2020 gave them the opportunity to pick up stocks that were unfairly punished.
Overseas, relative valuations of international developed stocks and emerging markets are approaching extremes relative to US stocks, which means the spectrum for relative outperformance is improved. In the emerging markets, the role of China has become worthy of increased attention. The confluence of recent regulatory changes, housing market deleveraging, and political power concentration against a backdrop of US-China trade friction and changes in relative force projection in Central and East Asia by the two countries, is worthy of exploration beyond this newsletter. For now, we’ll share that we are watching developments with interest and prefer the ability of our emerging market managers to shift allocations in their funds, rather than having large allocations to index-based funds where the geographic allocations are fixed.
We hope this holiday season is one of joy when you’ll gather with family in a way that may have been impossible last year. Best wishes to all of you, and we’ll talk soon.
Scott D. Benner
Cameron J. Barsness
Ryan V. Stevens