From time to time, an article from our reading outside the financial realm catches our attention because it describes so well a parallel process of translating information about risk into a judgment call about a reasonable plan of action in the face of changing circumstances. So, we share “Understanding Risk,” a piece by one of our favored Covid commentators, for its well-reasoned discussion of risk as it relates to our physical peril, with important takeaways for how we digest the ever-present and always changing spectrum of financial risk in our work for you.
Your Local Epidemiologist (YLE)” is written by Dr. Katelyn Jetelina, MPH PhD—an epidemiologist, biostatistician, professor, researcher, wife, and mom of two little girls. During the day she has a research lab and teaches graduate-level courses, but at night she writes this newsletter. Her main goal is to “translate” the ever-evolving public health science so that people will be well equipped to make evidence-based decisions. This newsletter is free thanks to the generous support of fellow YLE community members. Please see the original post here: Your Local Epidemiologist
We’re coming to the end of a wave. The CDC is changing guidance. Schools are removing mask mandates. More than 253 million people have at least one dose of the vaccine. A lot is changing, and today looks very different from March 2020. Together, many of us are reflecting on our own risk tolerance and possibly recalibrating.
Throughout the pandemic, public health practitioners (including myself) have been doing a terrible job of accurately communicating risk. Last week a New York Magazine article even said: “There isn’t one voice in public health that Americans can turn to and think, ‘This person is going to help me think about risk’ … this kind of bureaucratic timidity and caution… has been quite damaging.”
Contextualizing really small numbers and really large numbers is close to impossible for human brains, so communicating risk accurately and without bias is crucial. But lack of risk communication isn’t because of bureaucratic timidity. It’s because risk is multidimensional, complicated to quantify, and even more difficult to communicate. This is especially true with infectious diseases, as risk changes with time and varies across different people, and individual-level risk needs to be weighed with population-level risk.
Nonetheless, this post is an attempt to answer this challenge; an attempt to help you think about the quantitative, average risk of COVID-19 from multiple perspectives.
Preface: Risk isn’t just about numbers
First, we need to recognize that risk calibration is about more than just numbers. Objective numbers cannot be separated from subjective experience when assessing risk. In other words, risk calibration is based on the statistical and physiological chances of disease but also dependent on where you were born, where you live, who you are, how often you do something, the reality you’re forced to navigate, and the complexity of decision-making.
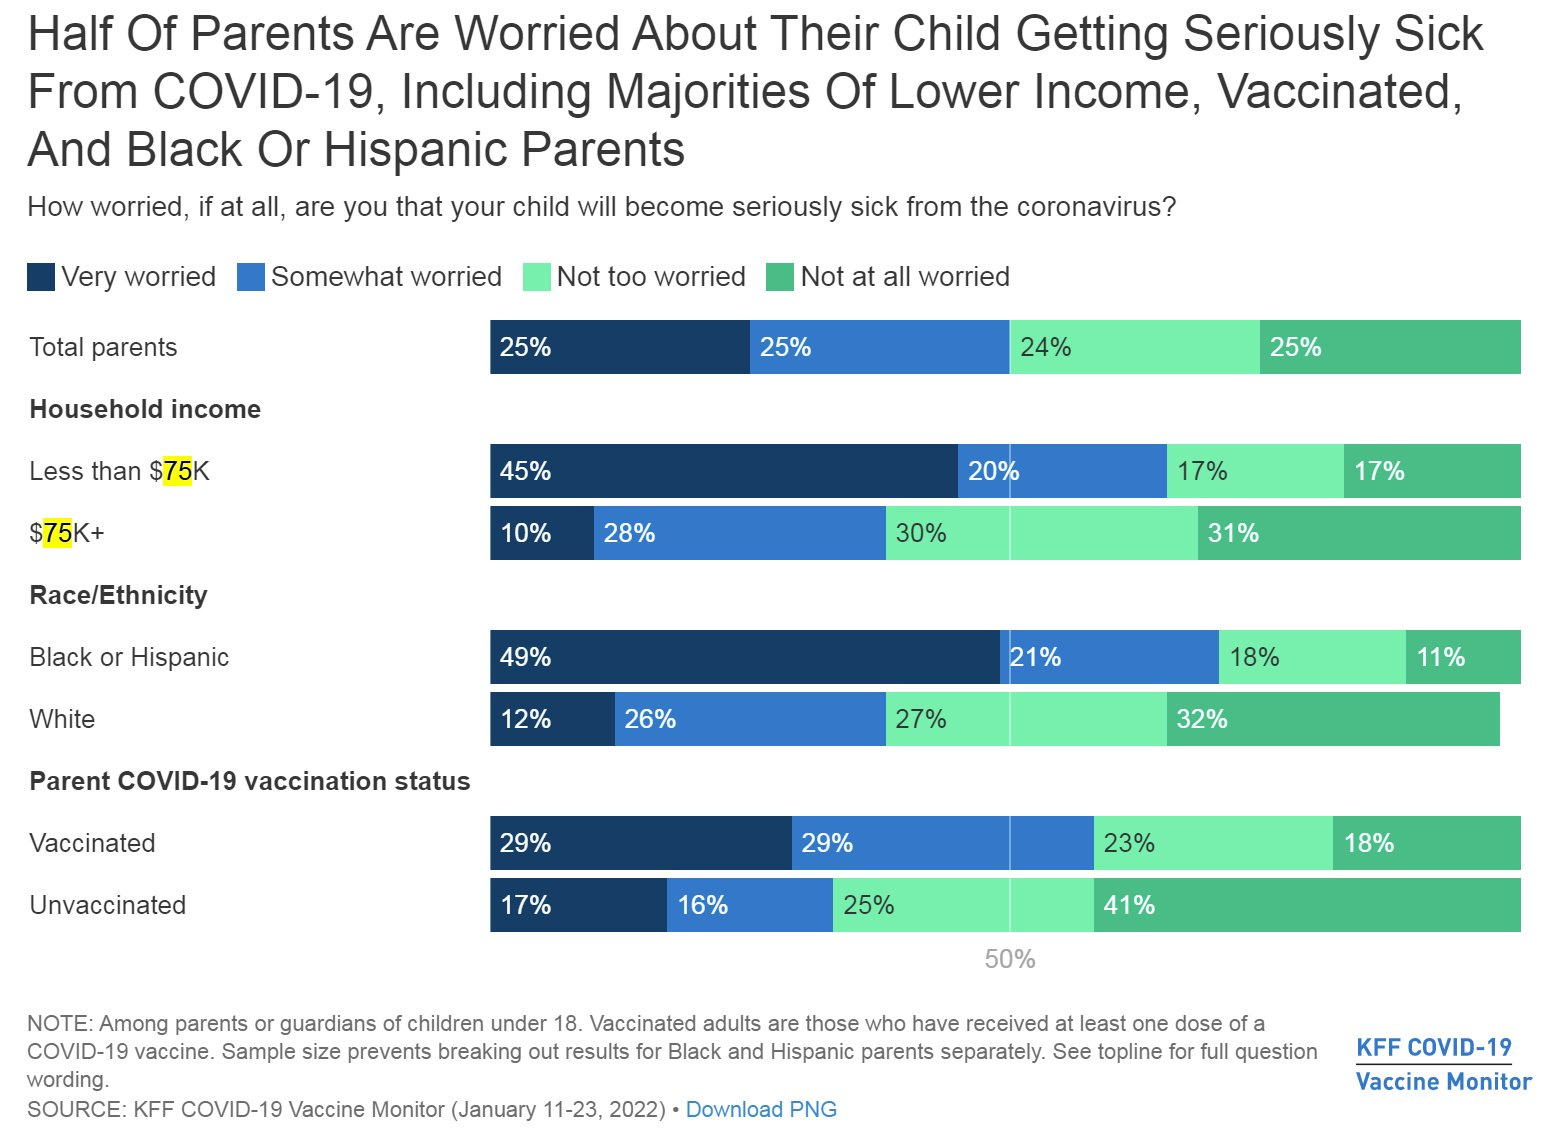
For example, it’s no coincidence that more Black and Hispanic people think schools should continue to require masks compared to Whites. Black or Hispanic parents are also more worried about their child getting seriously sick from COVID-19 than White parents (see Figure below). While risk of COVID-19 is biologically the same, what perpetuates that disease is not. Risk calibration is influenced by inequities. For example, Black and Hispanic people were/are more likely to die from COVID-19 due to a myriad of social reasons. The trauma from losing someone close to you or losing millions in a community can impact risk calibration. For parents, dire consequences of missing work because of a school exposure may impact risk calibration.
So, while this post provides many quantitative numbers, please recognize that numbers are only half the story when calibrating or recalibrating individual-risk. Numbers shouldn’t (always) discount subjective experience; it’s a balance.
Risk of dying from COVID-19
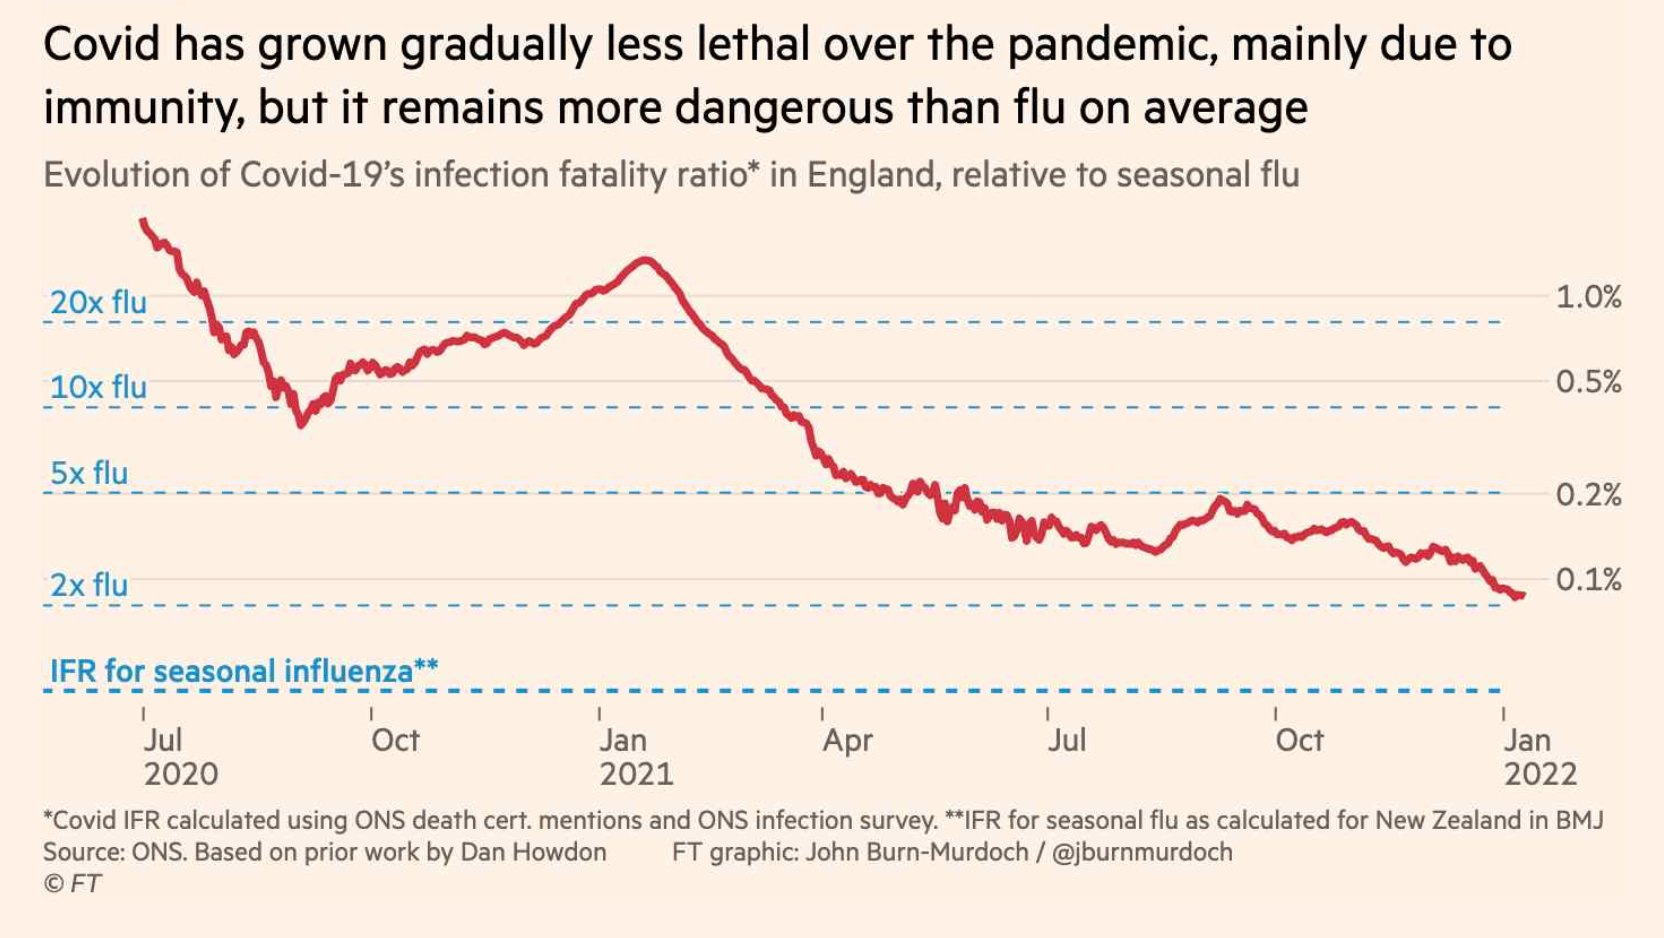
The risk of dying from COVID-19 is decreasing over time thanks to vaccines, infection-induced immunity, therapeutics, better understanding of care, and many more factors. In the U.K., the risk of mortality from an infection is about 0.1% right now.
But, what does 0.1% actually mean? For non-epidemiologists, it’s much more helpful to have a “relative risk.” In other words, how does the risk of dying from COVID-19 compare to other things in our world that we are much more familiar with? For example, the chart below compared the infection fatality ratio of COVID-19 to flu.
In their 2014 book the Norm Chronicles—an entertaining, data-driven guide to the statistics of personal risk—authors Blastland and Spiegelhalter use an ingenious measurement: MicroMort (MM), or a one in a million chance of dying. For example, the average person driving 250 miles is one MM—you have a one in a million chance of dying if you drive 250 miles. They used this standard of measurement to define risk for all types of random activities. I complied some below:
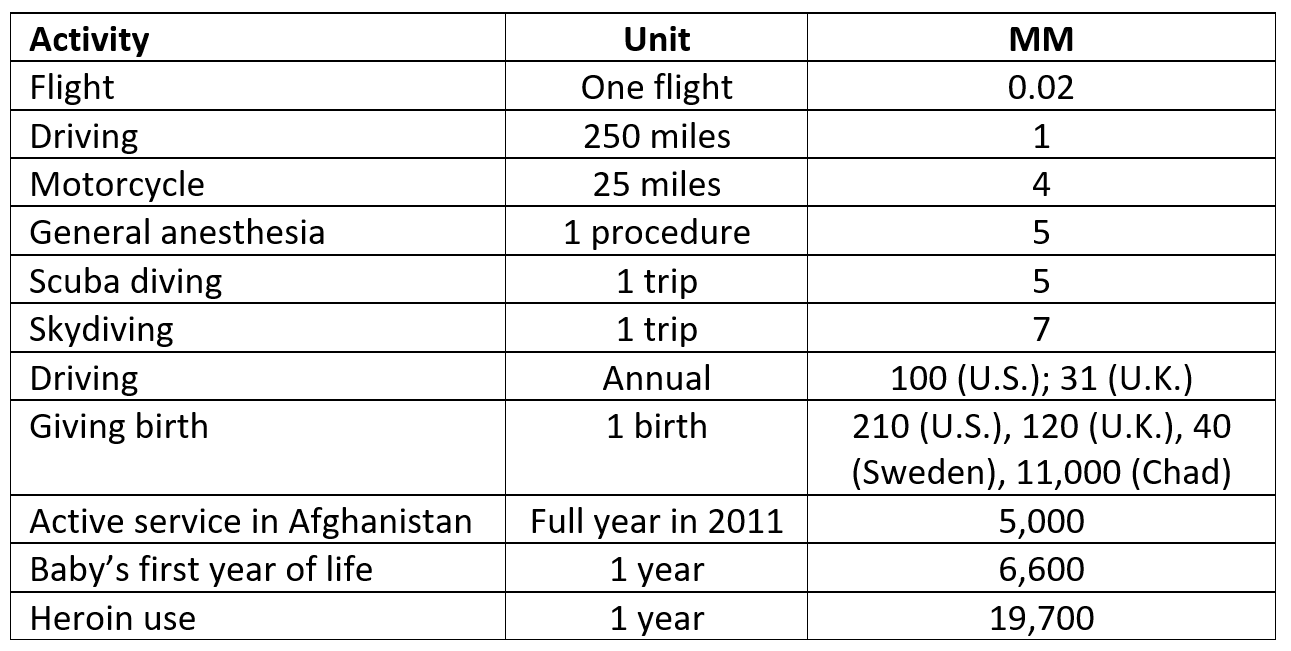
MicroMort (one in a million chance of dying) per activity. Data from Norm Chronicles by Blastland & Spiegelhalter (2014). Table developed by Dr. Katelyn Jetelina/YLE
Because MM’s are standardized, we can compare one activity to another. For example, the risk of giving birth to two kids in the U.S. (420 MM) is roughly the same risk as riding 2,800 miles (across the U.S.) on a motorcycle (448 MM).
We can roughly calculate MM after confirmed COVID-19 infections. I pulled CDC data on cases and mortality, by age and vaccination rates, during the first week of January 2022. After many calculations on my whiteboard, this is what I came up with:
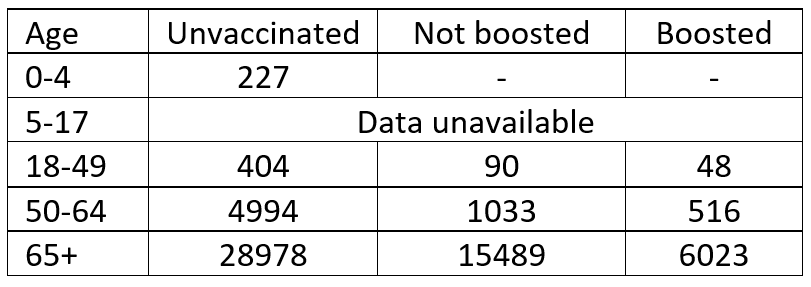
MicroMort (or one in a million chance of dying) from a COVID-19 infection during the Omicron wave, using CDC case and mortality data from January 1, 2022. Calculations made by Katelyn Jetelina/YLE.
Because “dying from COVID-19” is new in our risk repertoire, we can contextualize it by comparing it to other activities, which may help calibrate risk. For example:
- The risk of a 0-4 year old dying from a COVID-19 infection (227 MM) is about the same as the risk of a mom dying from childbirth in the U.S. (210 MM).
- For a vaccinated 18-49 year old, the risk of dying from an Omicron infection (90/48 MM) is less than the annual risk of dying on the road (100 MM).
- For a boosted 50-64 year old, the risk of dying from an Omicron infection (516 MM) is about the same risk as driving for 5 years in the U.S. (500 MM).
- For an unvaccinated 65+ year old, the risk of dying from an Omicron infection (28,978 MM) is about as risky as 1.5 years of heroin use (29,550 MM).
- For a boosted 65+ year old, the risk of dying after an infection (6,023 MM) is about as risky as a baby’s first year of life (6,600 MM). Or, it’s a little more risky than one year of active service in Afghanistan in 2011 (5,000 MM).
There is never zero risk of dying from COVID-19. Nothing has zero risk. But the risk is substantially reduced after vaccines. For some, it may be comparable enough to other things in our life to take a deep breath.
But, as we all know, mortality isn’t the only possible outcome of COVID-19 infection.
Risk of COVID-19 hospitalization
Unfortunately we can’t use MM with hospitalizations, because I don’t have the MM for hospitalizations from car accidents, for example. But the government of British Colombia compiled the nice table below of the risk of COVID-19 hospitalization after infection based on age, gender, vaccination status, and vaccine dosage. Again, these are percentages, and it’s difficult to know what a percentage actually means. This tool may be more useful for looking at patterns.
The majority of these numbers are very, very small. For example, for a healthy boosted person, the chance of hospitalization is about 1 in 500 breakthrough infections. But there are still groups with meaningful risk, even after vaccinated. For example, the risk of hospitalization is 1 in 10 for a boosted older adult male with multiple at-risk conditions. (This is why it’s still critical to keep transmission as low as possible. Denmark is learning a hard lesson about this right now.)
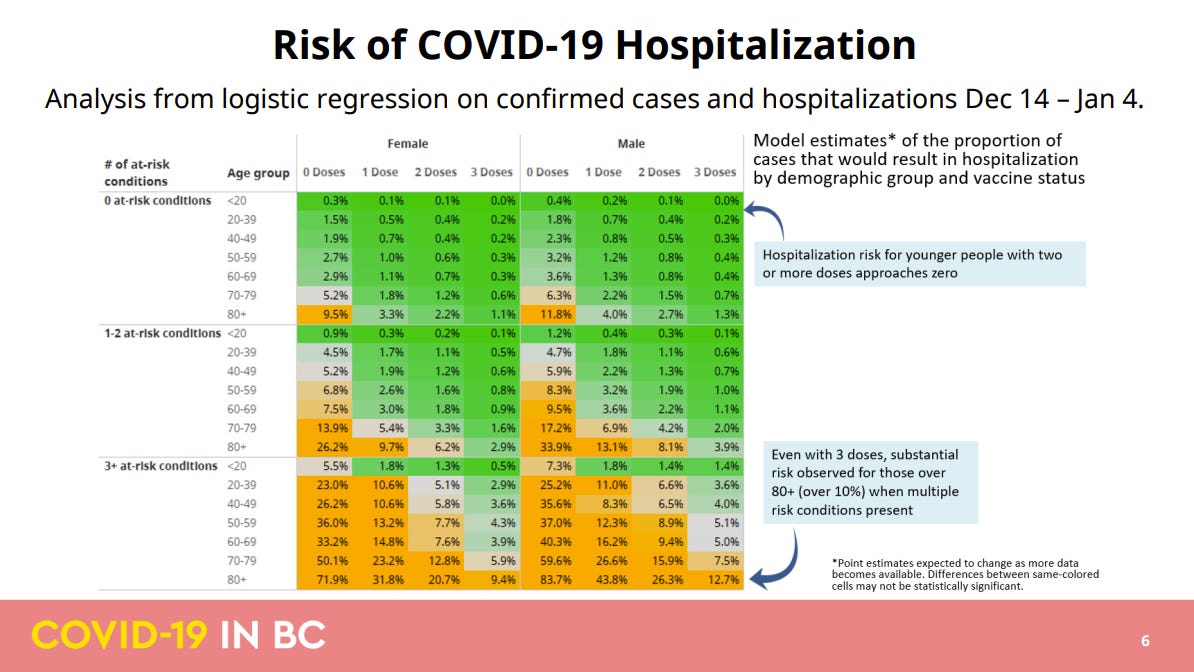
(Health Sector Information, Analysis and Reporting · Government of British Columbia)
The chart above isn’t useful for parents, as risk is lumped for age groups less than 20 years old. So I pulled a table I compiled from a previous YLE post that shows the risk of hospitalization by age group assuming no vaccination. The risk of hospitalization from a COVID-19 infection is variable by age, but largely comparable to RSV and flu.
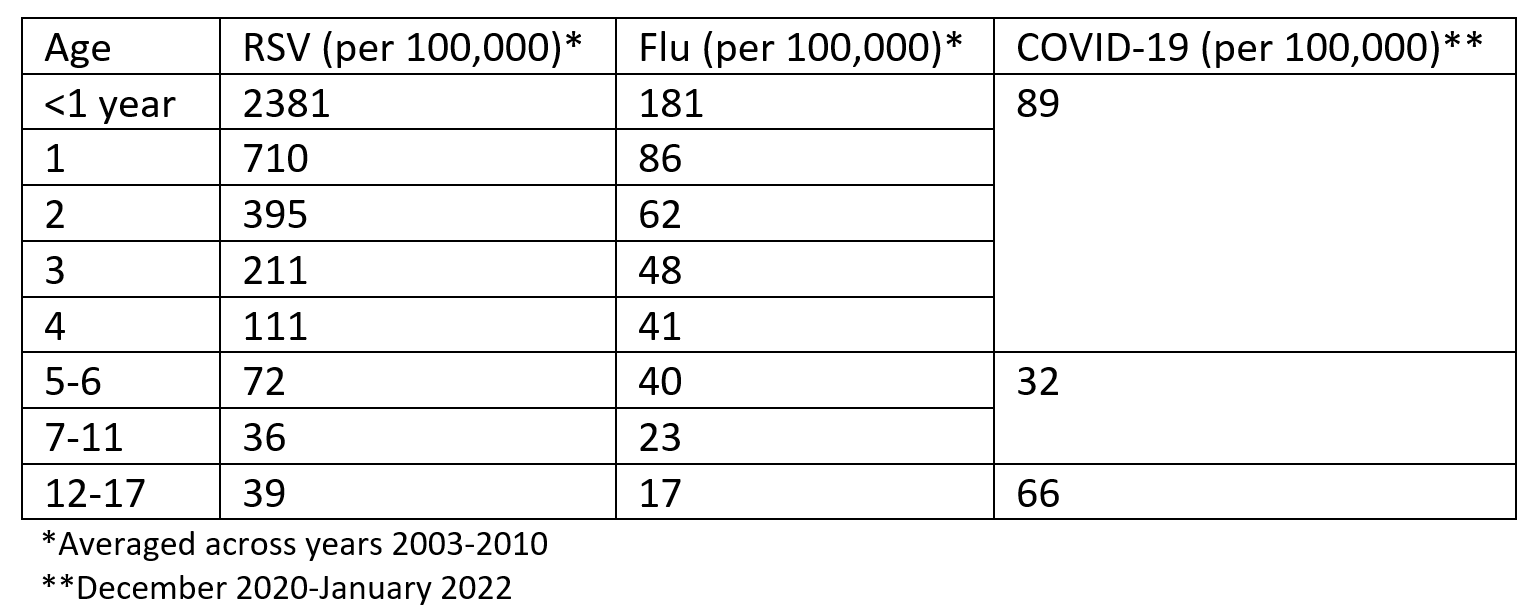
Annual rate of hospitalizations for viral diseases per 100,000 children in the United States. Table created by Katelyn Jetelina/YLE, based on data from two sources: RSV/Flu from Goldstein et al and COVID19 from CDC’s COVIDNet.
Risk of long COVID-19
The risk of long COVID-19 from an infection is certainly real. There have been hundreds and hundreds of publications showing a detrimental impact of long-term SARS-CoV-2 on almost every organ in our body system. Among unvaccinated adults, the risk of long COVID-19 after an infection is about 10–30%. This means a risk of about 1-3 in 10 infections. Risk is higher for women and/or for those initially hospitalized for COVID-19 (here, here, here). But long COVID-19 occurs after asymptomatic infections, too. Some countries, like Finland, estimate long COVID to be higher. In one meta-analysis, 45 studies found 72% of people (mostly hospitalized) reported at least one symptom for 12+ weeks after initial COVID-19 infection. Thankfully, the risk of long COVID-19 among kids remains relatively low (around 2-7%).
Vaccines help. A number of articles have shown vaccines reduce the chances of long COVID-19:
- A study in the New England Journal of Medicine found the rate of long COVID-19 among vaccinated hospital workers was 0.5%. This equates to about 1 in 200 breakthrough cases.
- Another study in the Lancet found the rate of long COVID-19 among fully vaccinated breakthrough cases was half the rate among unvaccinated (5.2% vs. 11.4%). Here, the risk of long COVID-19 among vaccinated is 1 in 20 breakthrough cases.
- A more recent preprint study also found vaccination to reduce long COVID-19 by 40% (9.5% vs. 14.6%). This equates to 1 in 10 breakthrough cases.
So vaccines help reduce the chances of long COVID-19, but we don’t know by exactly how much yet, as estimates vary greatly.
Risk of infection
All of these risk estimates are anchored on getting infected in the first place. Unfortunately, risk of infection is one of the most difficult to calibrate because it changes dramatically with the ebb and flow of the virus. In short, the chances of infection are dependent on two things:
- Coming in contact with an infected person; and,
- The infected person transmitting the virus to you.
The chances that you show up to an event and someone has COVID-19 (whether they know it or not) are dependent on level of community transmission and number of people at that location. For example, let’s say we have 15 people at my office in Texas. What is the chance that at least one person in the group was COVID-19 positive during the Omicron wave? This depends on where we were at during the wave:
- Peak: There was a 99.5% chance that at least one person in the group was positive
- Halfway down the peak: 91.3% chance
- Tail end of the peak (where Texas currently is): 54% chance
- End of the Omicron wave: 14% chance
The more people you have and the more transmission you have, the more likely the virus is there, too.
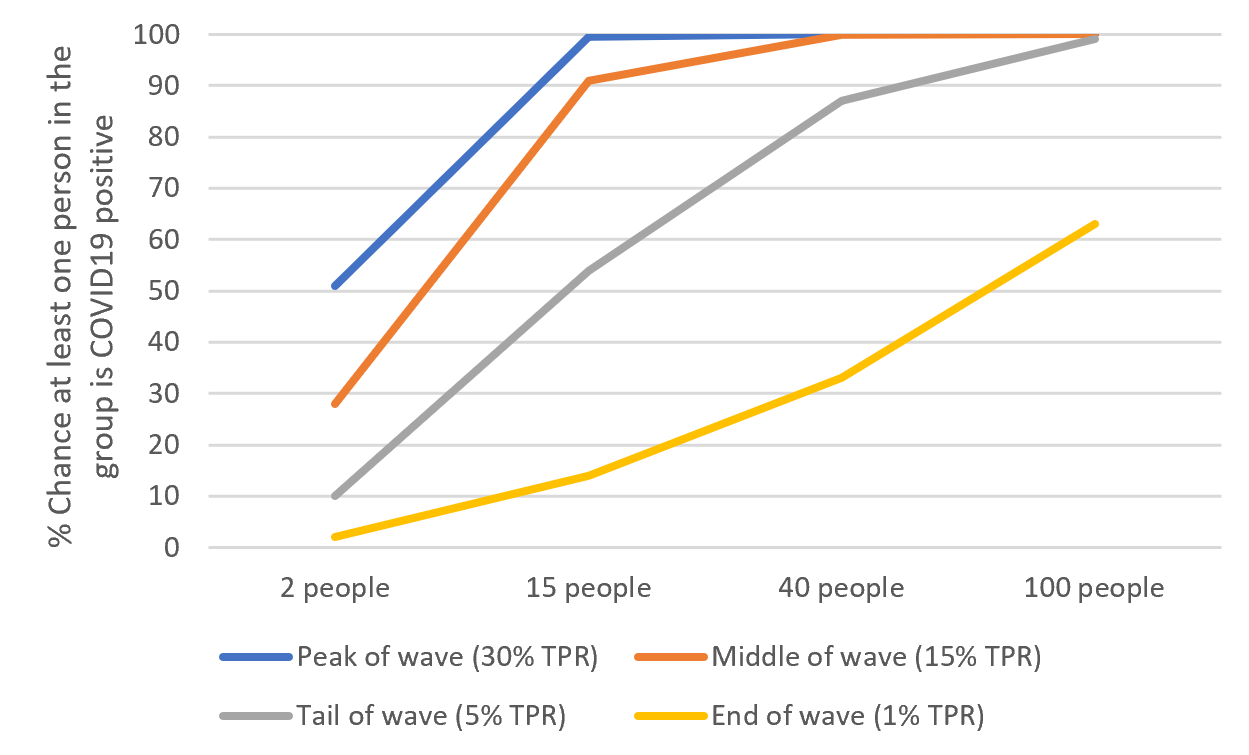
Chance at least one person in the group is COVID19 positive, graph by Katelyn Jetelina/YLE. Modeling from Bob Watcher.
Of course, if someone is infected, this doesn’t automatically mean you’ll be infected. That virus then needs to be effectively transmitted. SARS-CoV-2 is becoming better and better at transmitting because it’s getting better and better at evading our immunity.
But vaccines still help. A recent study found that, on average, a household index case (i.e. someone infected in a household) will transmit the virus to other people in the household 68% of the time. If the index case was boosted or previously infected, household transmission only happened ~50% of the time. So, if you have the virus and are boosted, transmission is basically the flip of a coin.
But we have other ways to break transmission chains, too. Like ventilation, antigen testing, and masks.
Bottom line
Risk calibration is incredibly complicated and hard to do. I find myself lost in this all the time. But, sticking to two themes helps:
- When transmission is low, relax. When transmission is high, take precautions. Reasonable measures can prevent infection and, perhaps more importantly, prevent transmission to vulnerable pockets of society. But if you do get infected…
- Vaccines do a superb job of keeping us out of the hospital.
We’ve done the best we can in an evolving landscape without clear risk communication. But we, public health practitioners, need to do better. Risk communication can and should to be part of our arsenal of preparedness for the next waves and public health threats beyond.
Love, YLE